




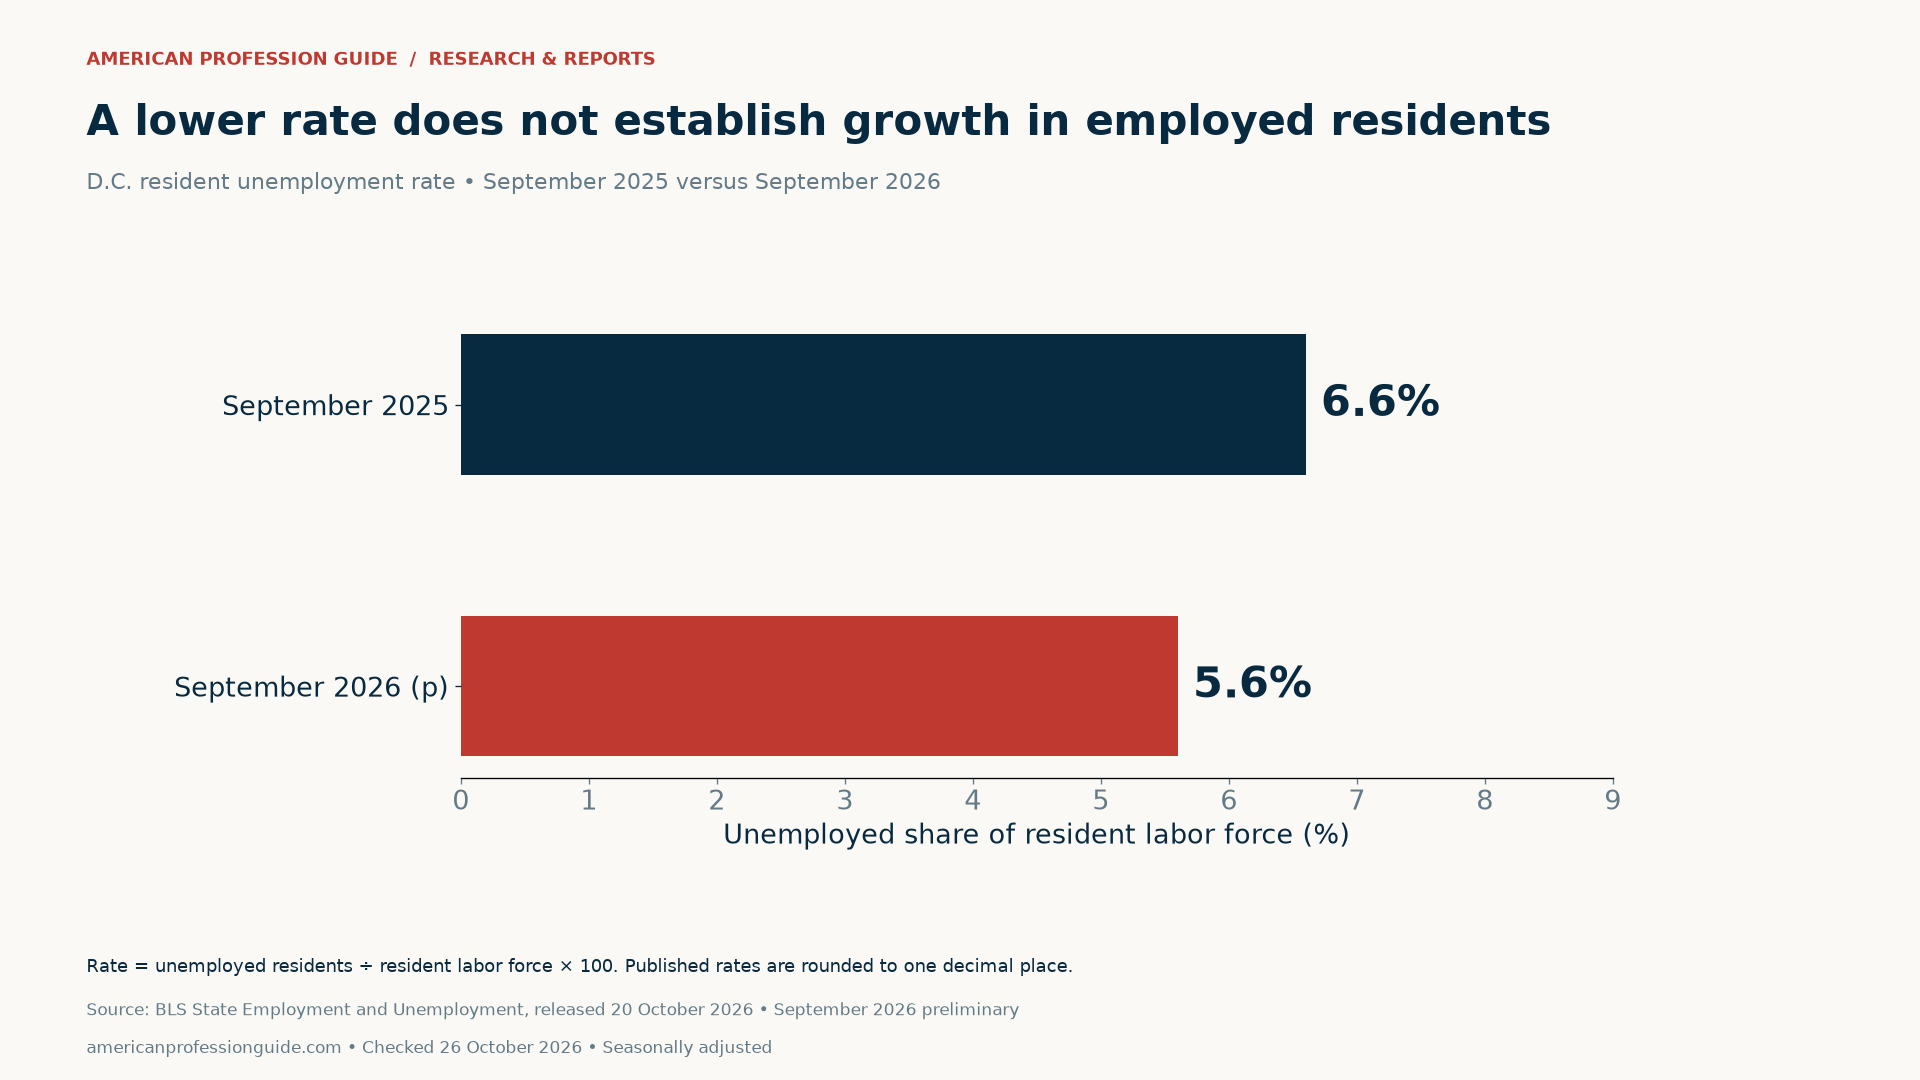
The job market by state in 2026 cannot be judged from one unemployment-rate headline. In the District of Columbia, the rate fell from 6.6% to 5.6% between September 2025 and September 2026. Yet derived employed residents declined by 1,221, while workplace payroll jobs fell by 25,800. Those findings describe different measures, and none tells you an individual applicant’s chance of finding work.
Checked October 26, 2026. We analyzed the October 20 Bureau of Labor Statistics release, covering September estimates. Our original diagnostic includes all 50 states plus D.C. It preserves BLS significance flags and separates people counted by residence from jobs counted at workplaces. September 2026 estimates are preliminary.
Job market by state in 2026: read two signals together
The BLS state employment and unemployment release combines two programs. Local Area Unemployment Statistics, or LAUS, describes resident people. Current Employment Statistics, or CES, measures nonfarm payroll jobs at establishments. A state can show falling unemployment alongside falling payroll employment without either series being an error.
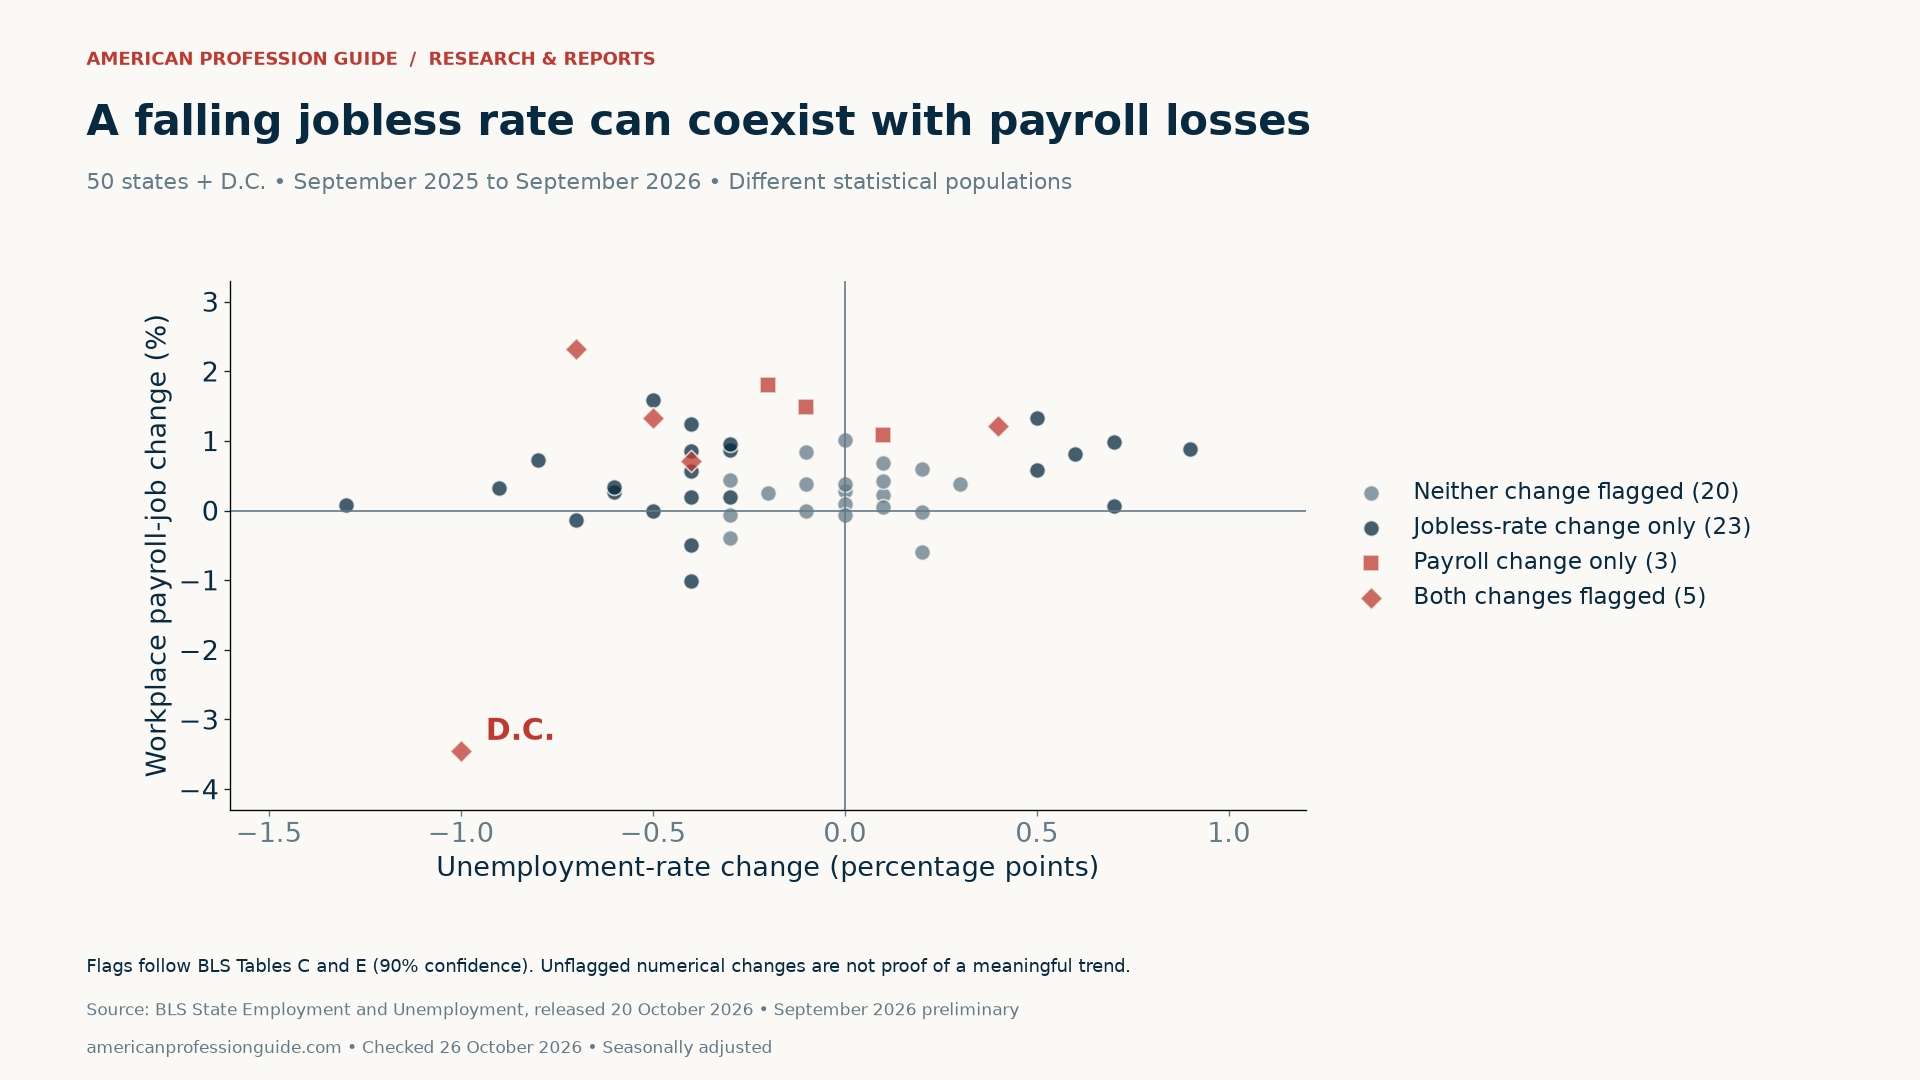
The horizontal axis shows the change in the published unemployment rate, in percentage points. The vertical axis shows the percentage change in payroll jobs. Moving left means a lower jobless rate; moving down means fewer payroll jobs. D.C. sits in the lower-left area. The position describes the combination, rather than a ranking of the best places to move.
Each marker also identifies whether BLS flags either annual change as statistically significant. A numerical change can be visible without meeting that test. Our downloadable data retain every jurisdiction, both source levels and both flags. We do not suppress unflagged observations or label every small movement an improvement or decline in underlying conditions.
D.C.’s unemployment rate: examine the denominator
An unemployment rate is unemployed residents ÷ resident labor force × 100. The labor force includes employed and unemployed people. It does not include every resident. Someone without a job is not automatically classified as unemployed: the technical definition includes availability and recent active job search, with a recall-related exception for people on layoff.
BLS Table 1 reports D.C.’s labor force falling from 408,743 to 402,894. Its unemployed population fell from 27,120 to 22,492. Subtracting the two components within this same resident series gives 381,623 employed residents in September 2025 and 380,402 in September 2026. The derived difference is −1,221 employed residents.
| D.C. resident measure | September 2025 | September 2026 (p) | Change |
|---|---|---|---|
| Civilian labor force | 408,743 | 402,894 | −5,849 |
| Unemployed residents | 27,120 | 22,492 | −4,628 |
| Derived employed residents | 381,623 | 380,402 | −1,221 |
| Published unemployment rate | 6.6% | 5.6% | −1.0 percentage point |
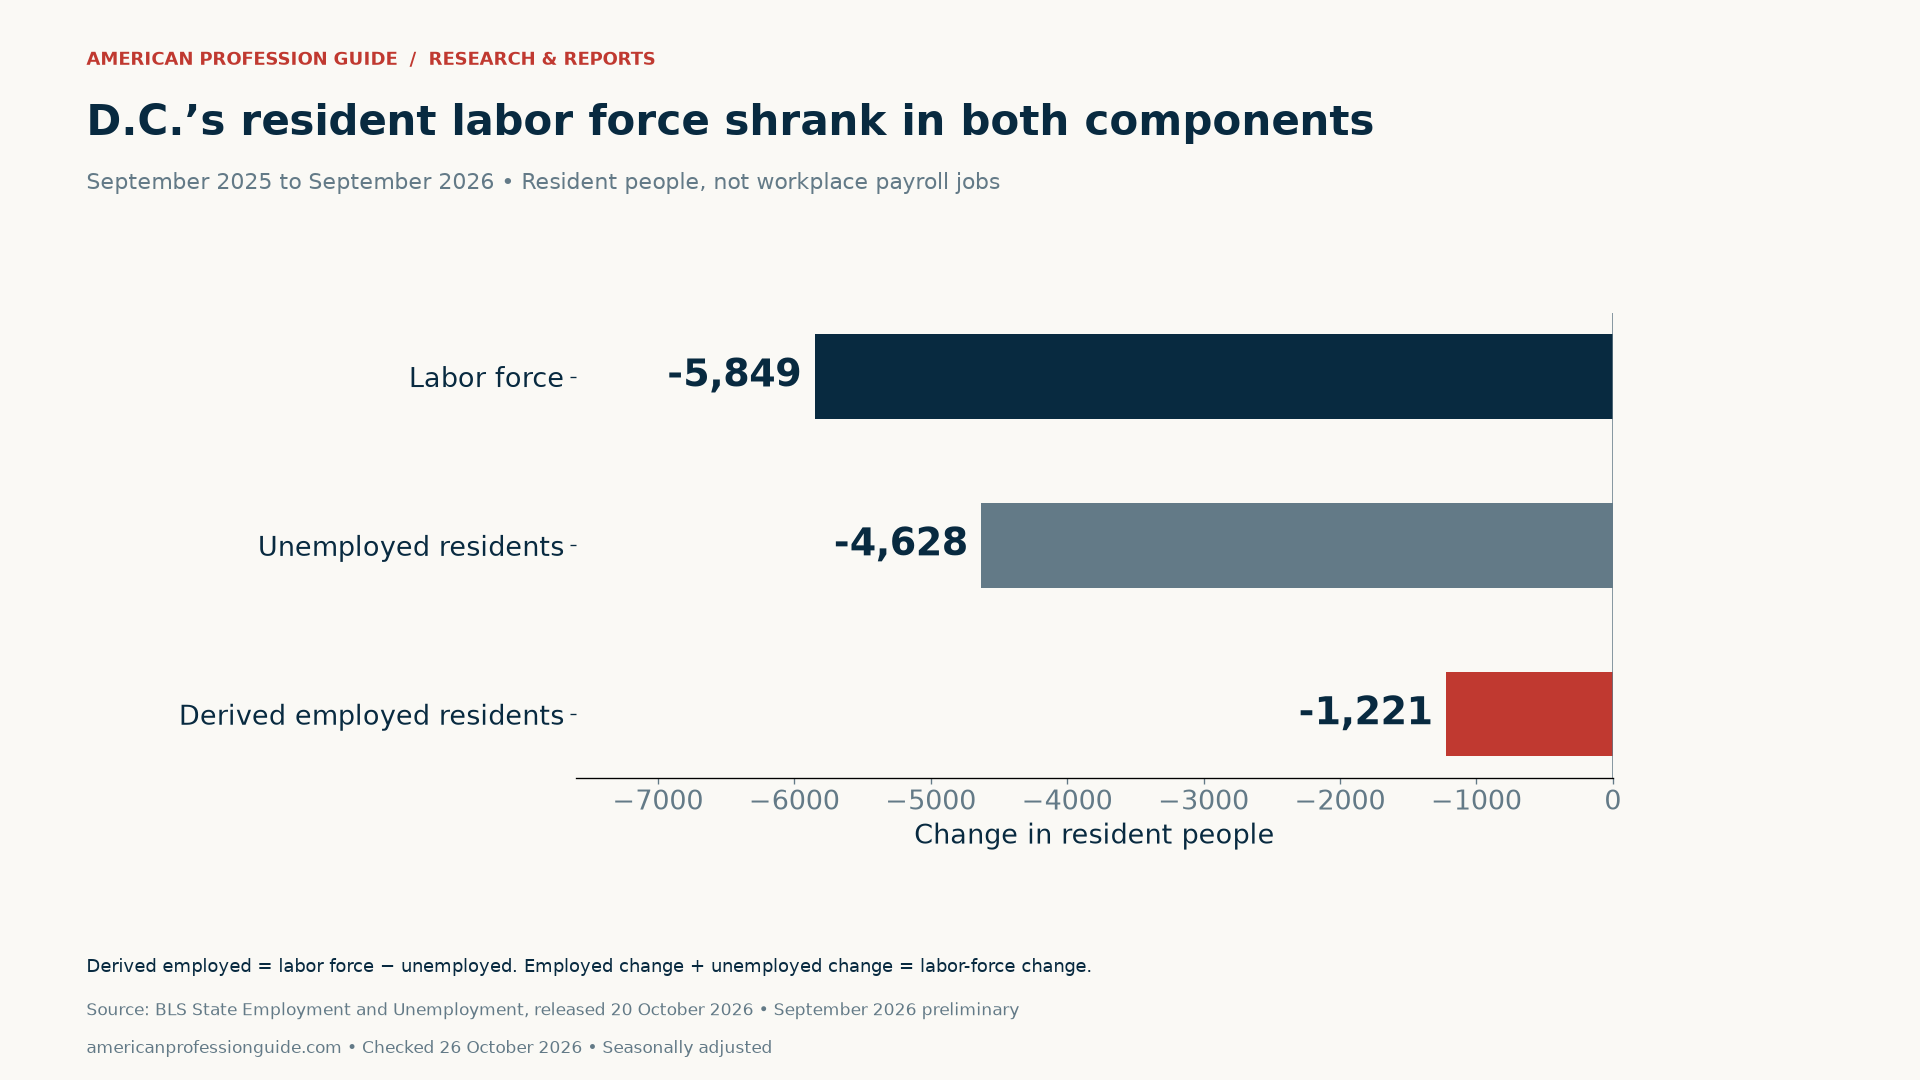
This arithmetic establishes the change in the reported components. It does not identify who entered or left the labor force, whether people moved, or why anyone stopped searching. Nor does it isolate federal layoffs or another employer’s decisions. Those explanations would require additional evidence. The figures here do not follow individual residents across the two dates.
Workplace payroll jobs answer a different question
In the establishment series, D.C. had 745,700 nonfarm payroll jobs in September 2025 and 719,900 in September 2026. The decline is 25,800 jobs, or about 3.5%. BLS identifies this annual payroll change as statistically significant in Table E. Its comparison concerns workplaces in D.C., including jobs held by commuters who live elsewhere.
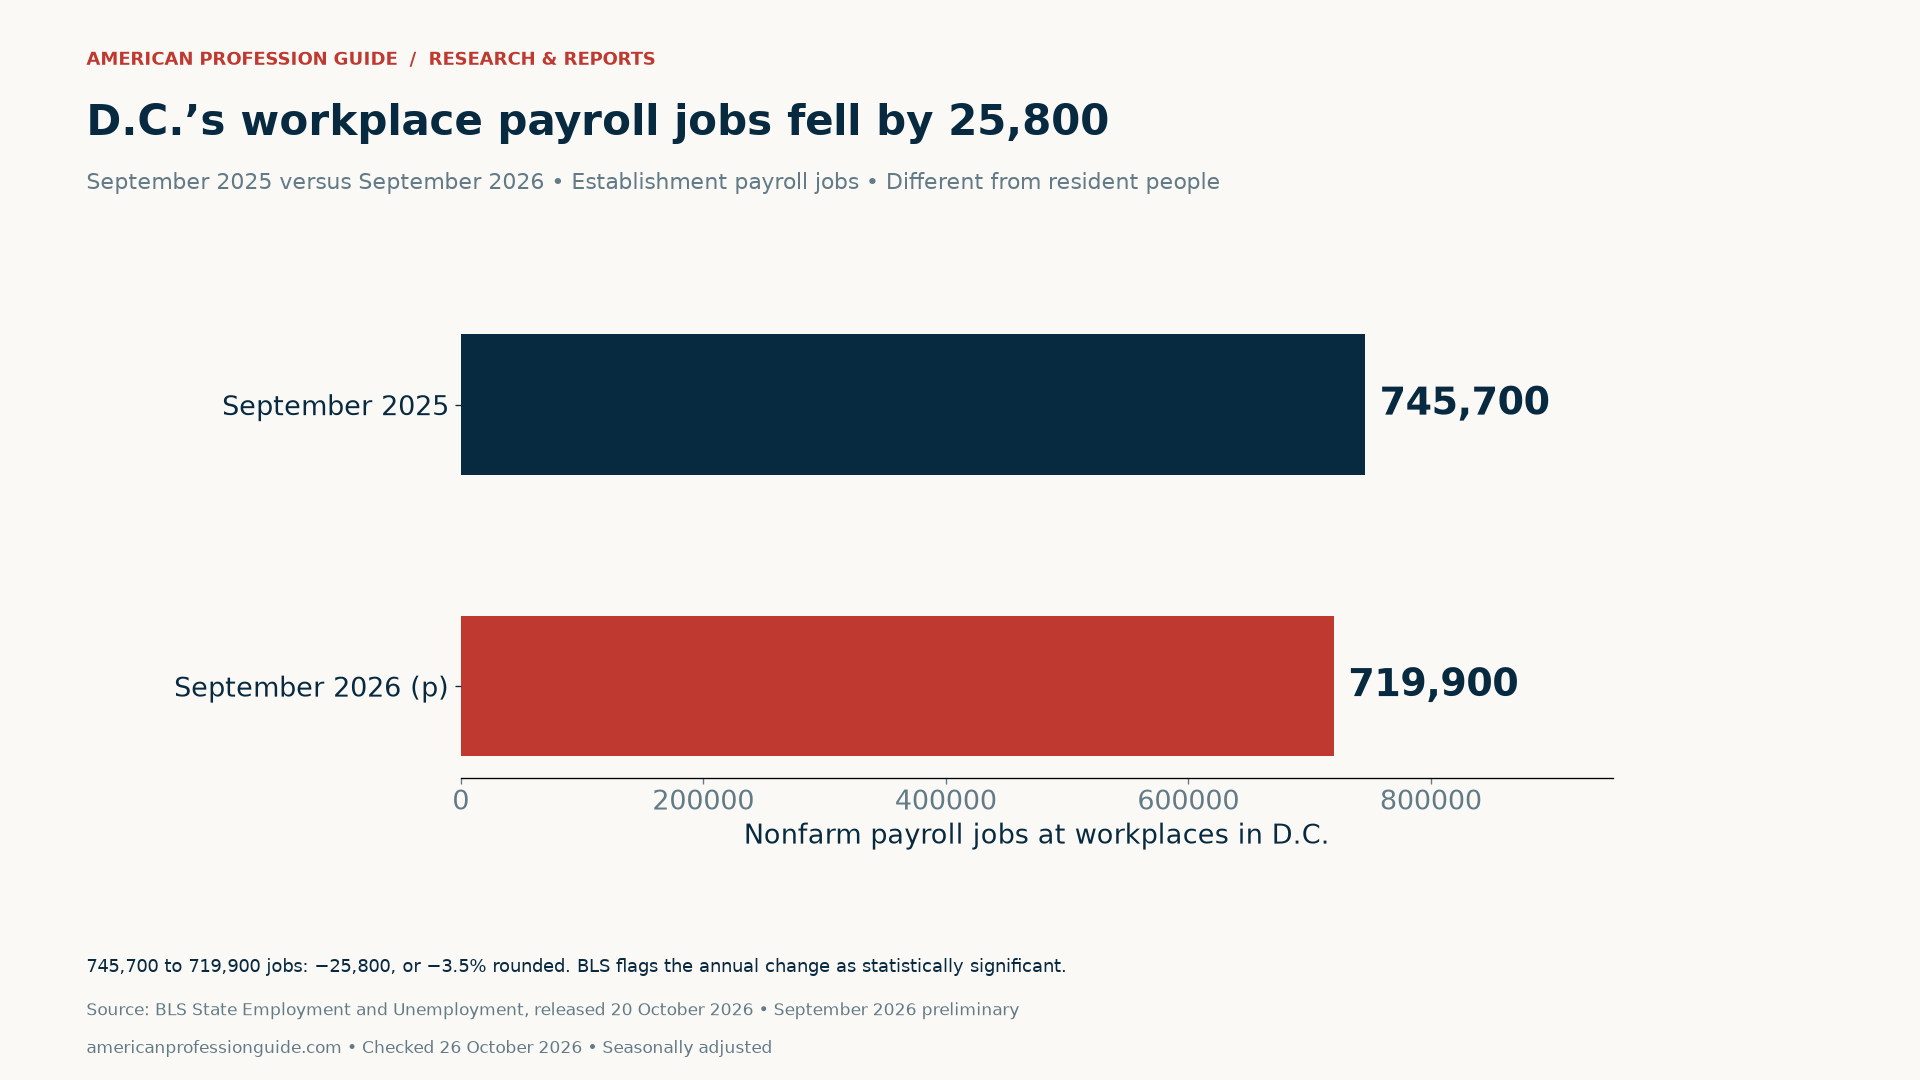
Payroll data can also count a person on more than one payroll more than once. Resident employment counts people under a different set of definitions and coverage. Therefore, the gap between the two totals is not a clean commuting estimate. Keep the units and geography attached to every number before combining evidence from the programs.

Statistical significance changes the state comparison
Across the 51 jurisdictions, BLS flags annual unemployment-rate decreases in 20 states plus D.C. and increases in seven states. It describes the remaining 23 states as having little change. For payroll jobs, it flags increases in seven states and a decrease in D.C.; the other 43 states are essentially unchanged under its significance framework.
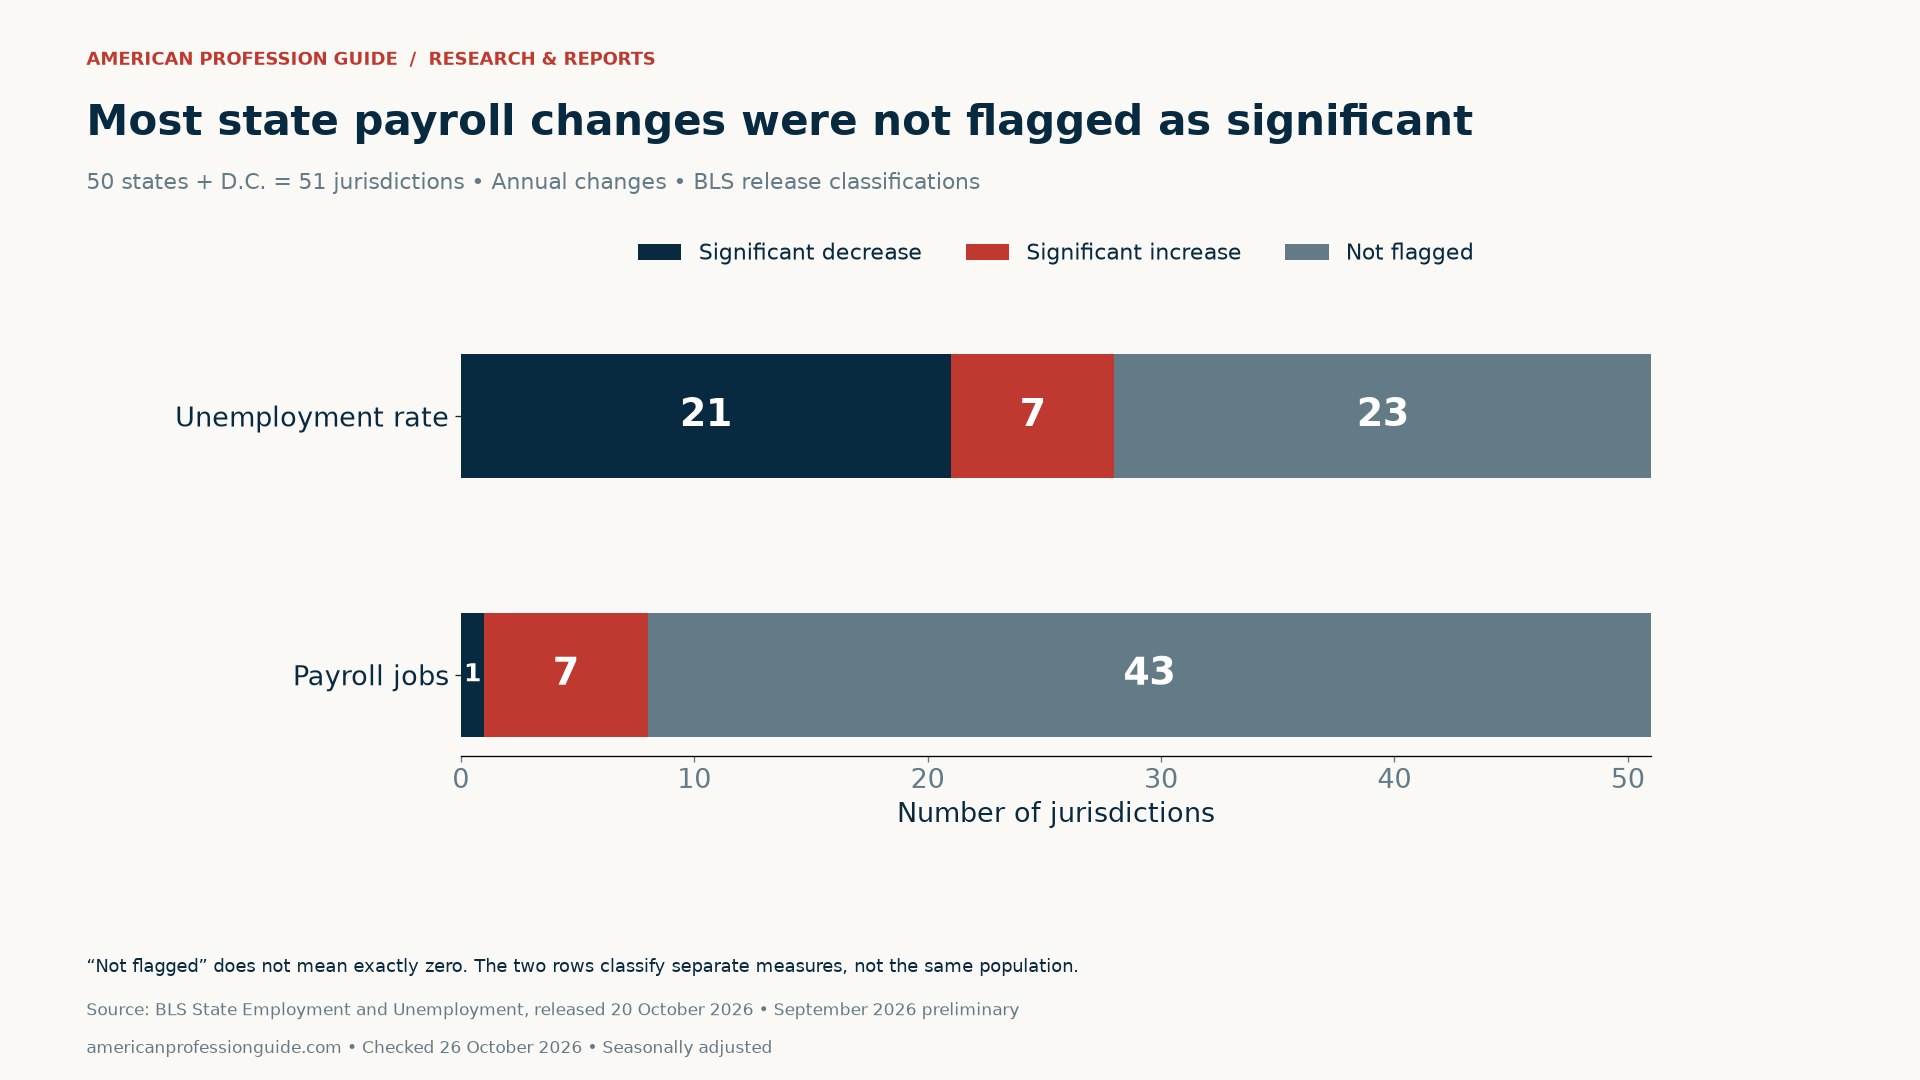
The release’s technical note uses a 90% confidence level for cited changes. We reproduce the published classifications rather than conduct new significance tests. Sampling, modelling and other errors remain relevant. Preliminary estimates and historical revisions can change the comparison in a later release.
Use the job market by state in 2026 as a starting point
First, choose the actual occupation, industry and local area relevant to your search. Then check current employer listings, qualification requirements and practical commuting limits. A statewide average can conceal local differences. It also cannot tell you whether employers need your particular experience or whether a specific vacancy remains open.
Next, assess compensation and costs using comparable evidence. Our metro purchasing-power study explains why nominal pay alone can mislead. Our engineering and software posting comparison shows why listing inventory and fresh advertisements can move differently. Neither source turns a state indicator into a personal hiring forecast.
Finally, record what remains unknown. The blank relocation worksheet separates people from jobs, residence from workplace, and preliminary from revised estimates. Add real role evidence and cost or commute notes separately. This keeps a broad economic signal from becoming the only basis for a major decision.
Methods and downloadable state data
We retained the official release’s rendered Table 1, seasonally adjusted Table 3 totals and the text containing Tables C and E. We joined by jurisdiction name, removed footnote markers and excluded Puerto Rico, the Virgin Islands and national aggregates. The resulting comparison contains exactly 50 states plus D.C., with no duplicate jurisdiction rows.
Table 3 reports levels in thousands; we convert its one-decimal inputs to job counts by multiplying by 1,000. Payroll percentage change is (current ÷ prior − 1) × 100. Unemployment-rate change subtracts the two published rounded rates. Derived employed residents equal labor force minus unemployed within LAUS. We never subtract a resident count from a workplace-job count.
The state labor market diagnostic data (CSV) include source levels, original arithmetic, flags and preliminary status. The blank relocation evidence worksheet (CSV) contains no measured personal records. All observations refer to September 2025 and September 2026; publication occurred October 20 and our checks October 26.
Suggested citation: American Profession Guide, “Job Market by State in 2026: Why Falling Unemployment Can Mislead Your Search,” checked October 26, 2026. Credit BLS for the source estimates and significance classifications, and this report for the diagnostic, derived resident employment and worksheet. Preserve the population, units, preliminary status and uncertainty notes when reusing a figure.


