







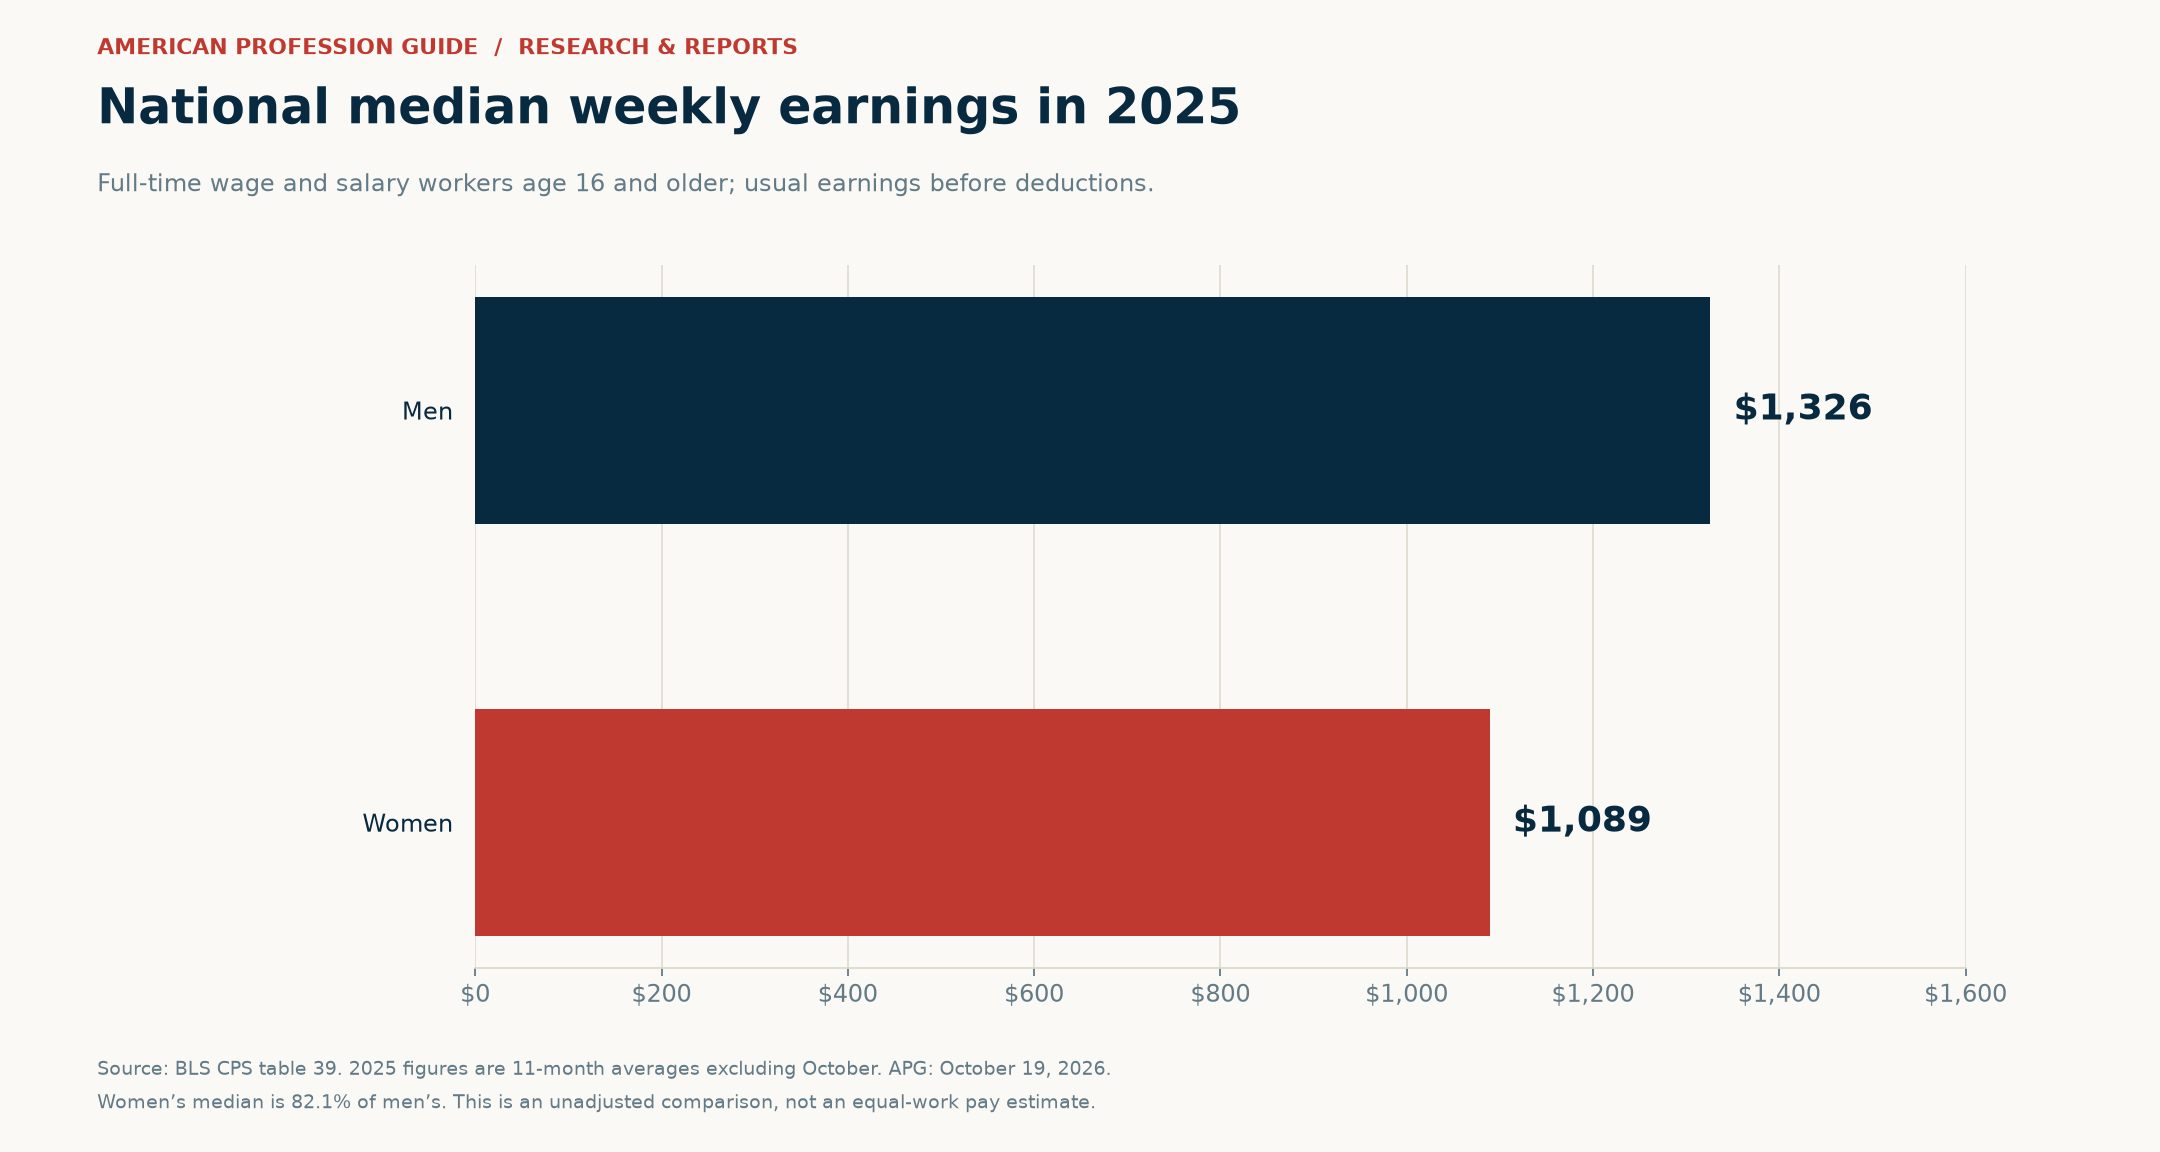
The gender pay gap varies widely across U.S. occupations. Among full-time wage and salary workers, women had median weekly earnings of $1,089, compared with $1,326 for men in the 2025 BLS figures. That puts women’s median at 82.1% of men’s, a difference of $237 a week.
American Profession Guide examined 565 detailed occupation categories in the federal earnings table. We found 83 occupations with published medians and at least 100,000 estimated workers of each sex. This report compares their earnings ratios, dollar differences, and proximity to equal medians. A downloadable file includes all 565 categories, including those outside the comparison set.
Read the date carefully: this is a 2026 research edition using 2025 earnings. The BLS annual figures average eleven months, excluding October, because the government shutdown prevented October data collection. BLS says these figures are not strictly comparable with other annual averages. We therefore make no year-over-year claims.
Start with the key findings, lowest earnings ratios, near-parity comparisons, or methodology. The downloadable dataset includes workforce estimates, source links, and eligibility flags.
Five findings from the occupational gender pay gap data
- The national ratio is 82.1%. The corresponding unadjusted gap is 17.9% of men’s median weekly earnings. It is not an estimate for identical workers doing identical work.
- Men’s median is higher in 81 of the 83 eligible occupations. Women’s median is higher in two. None has exactly equal published medians.
- Nine occupations are within five percentage points of equal medians. They range from pharmacists to fast food and counter workers, showing that a narrow gap does not necessarily mean high pay.
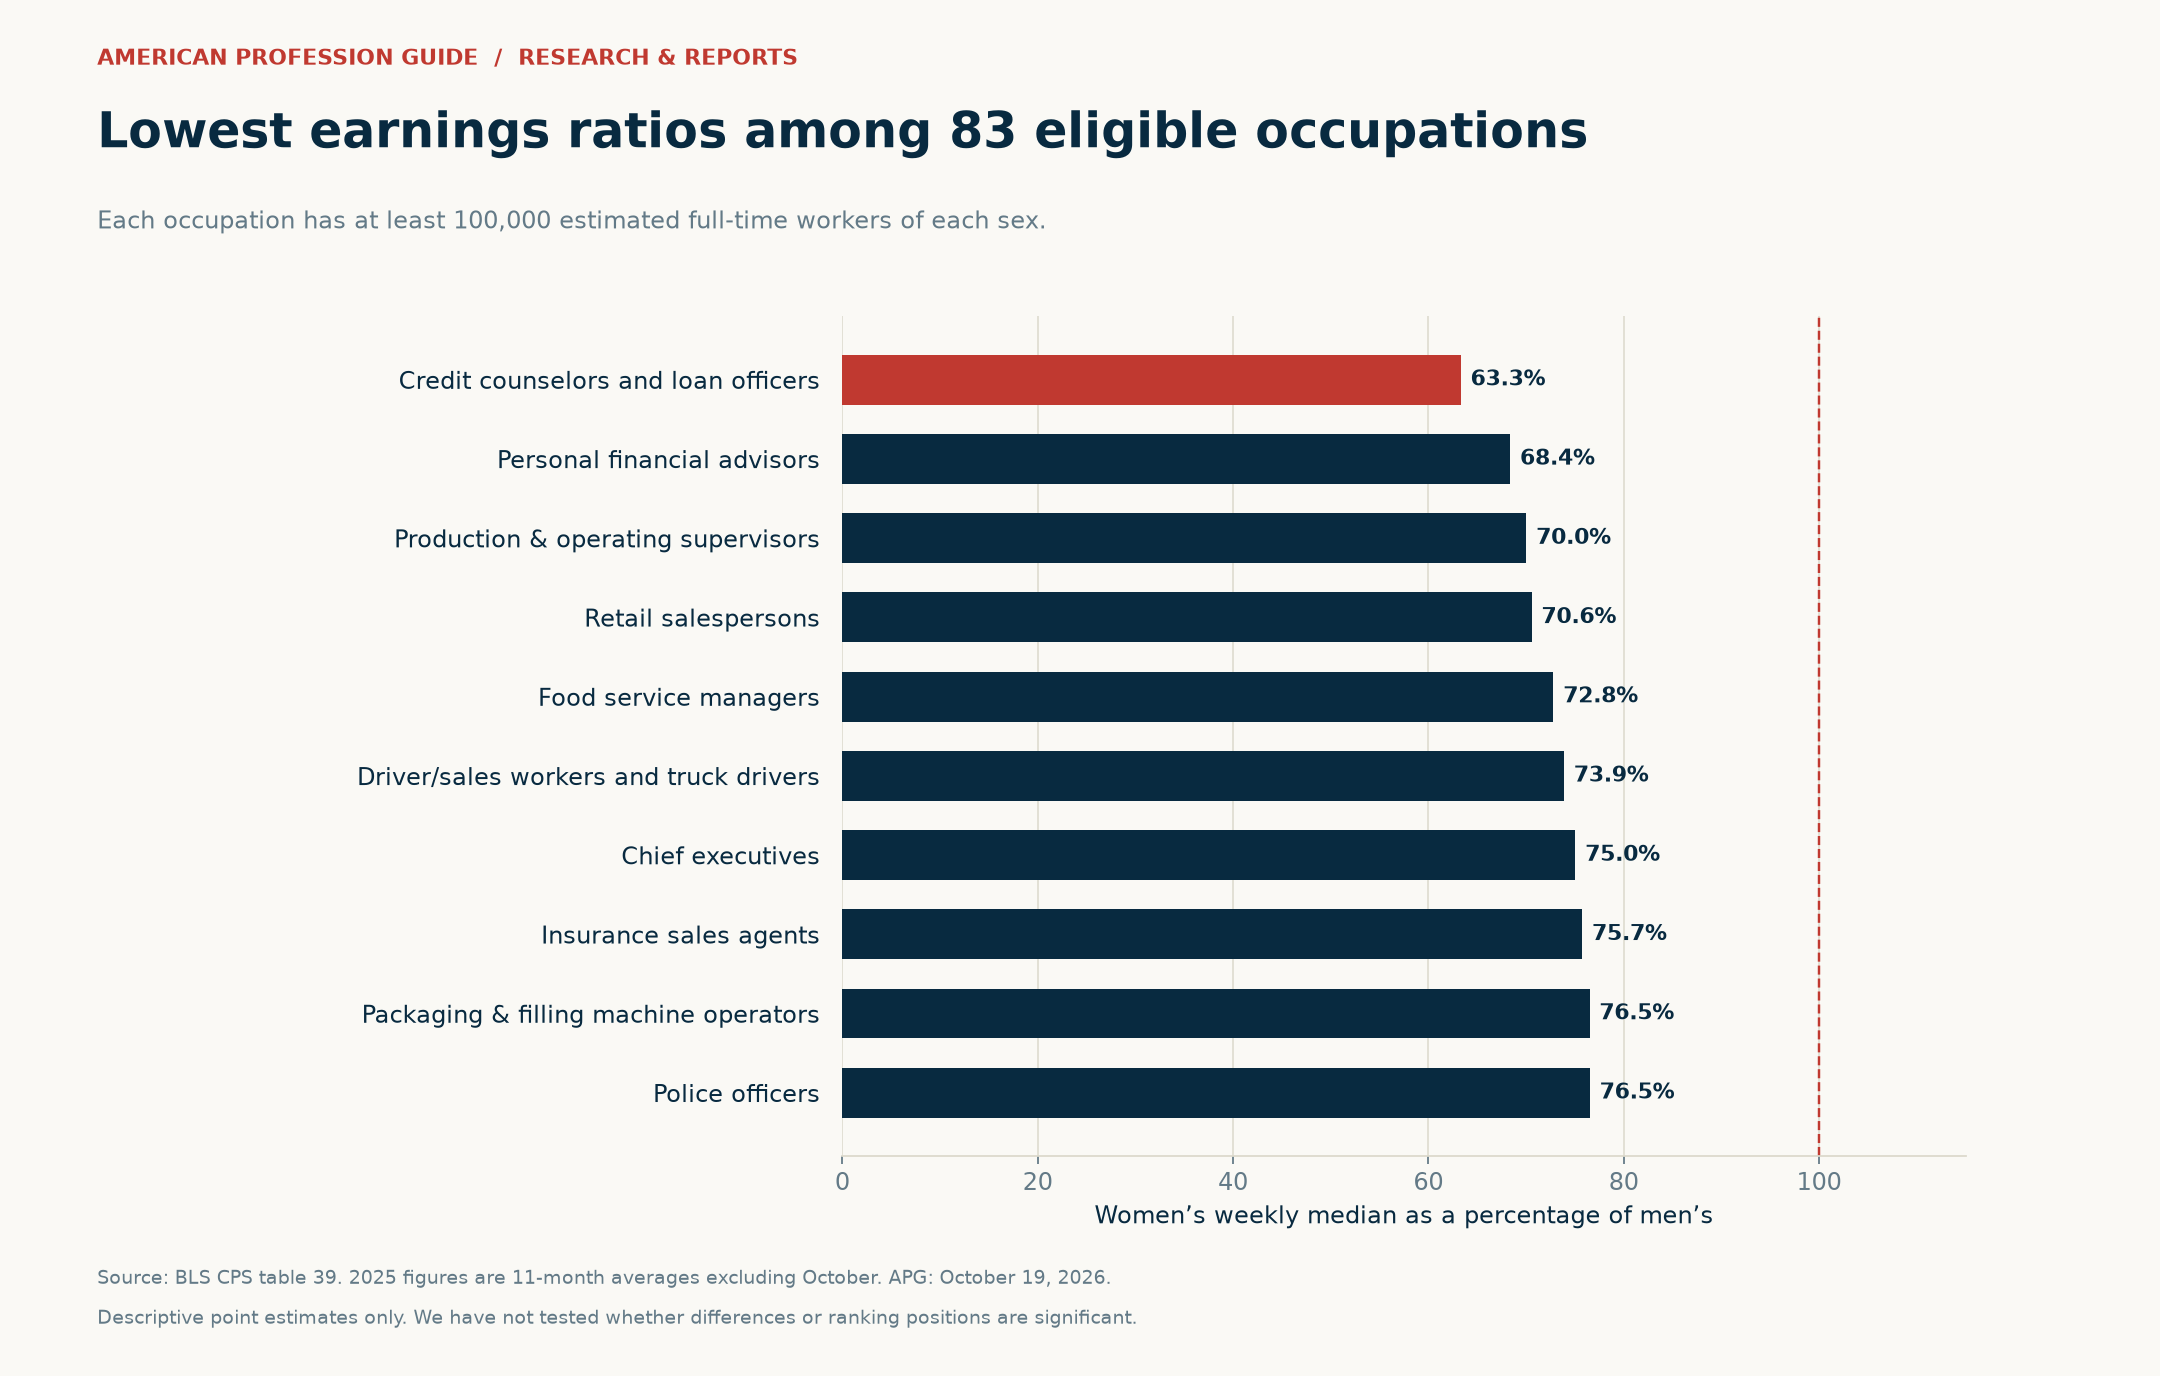
- Credit counselors and loan officers have the lowest ratio in this comparison set. Women’s weekly median is $1,108, or 63.3% of men’s $1,750.
- Dollar differences and percentage gaps tell different stories. Chief executives have a $773 weekly median difference, versus $642 for credit counselors and loan officers. Yet chief executives have the higher women-to-men ratio.
These are descriptive comparisons of published estimates. We did not calculate confidence intervals or test whether differences are statistically significant. Consequently, a small difference between two occupations’ ranks should not be treated as a meaningful performance league table.
What the gender pay gap measures here
Our source is BLS Current Population Survey table 39. It reports usual weekly earnings for full-time wage and salary workers by occupation and sex. The published groups are men and women; the table does not provide a separate analysis by gender identity.
Median means the midpoint of a distribution. Half of the relevant workers have earnings above that point and half below. Therefore, the difference between two group medians is not an average difference between matched pairs of employees. Nor does it describe every person in either group.
| Measure | Calculation | National result |
|---|---|---|
| Women-to-men earnings ratio | Women’s median ÷ men’s median × 100 | 82.1% |
| Unadjusted percentage gap | 100 − earnings ratio | 17.9% |
| Weekly dollar difference | Men’s median − women’s median | $237 |
For example, the ratio calculation is $1,089 divided by $1,326, multiplied by 100. The national ratio comes directly from the two national medians. It is not an average of the occupation-level ratios shown below. Averaging those ratios would answer a different question.
Who counts as a full-time worker?
Under the CPS definitions, full-time workers usually work at least 35 hours a week at their sole or main job. This does not mean everyone works the same hours. A 35-hour worker and a 50-hour worker can both be in the full-time group.
Usual earnings are before taxes and other deductions. They include usual overtime pay, commissions, and tips, but not the cash value of benefits. Earnings for people with multiple jobs refer to the main job. The earnings series excludes self-employed workers, including incorporated self-employed workers. It also excludes part-time workers from this particular table.
As a result, we do not divide weekly medians by 40 to invent hourly rates. We also do not multiply them by 52 and label the result observed annual earnings. Weekly, hourly, and annual pay measures require different information and cover different circumstances.
The gender pay gap across five broad occupation groups
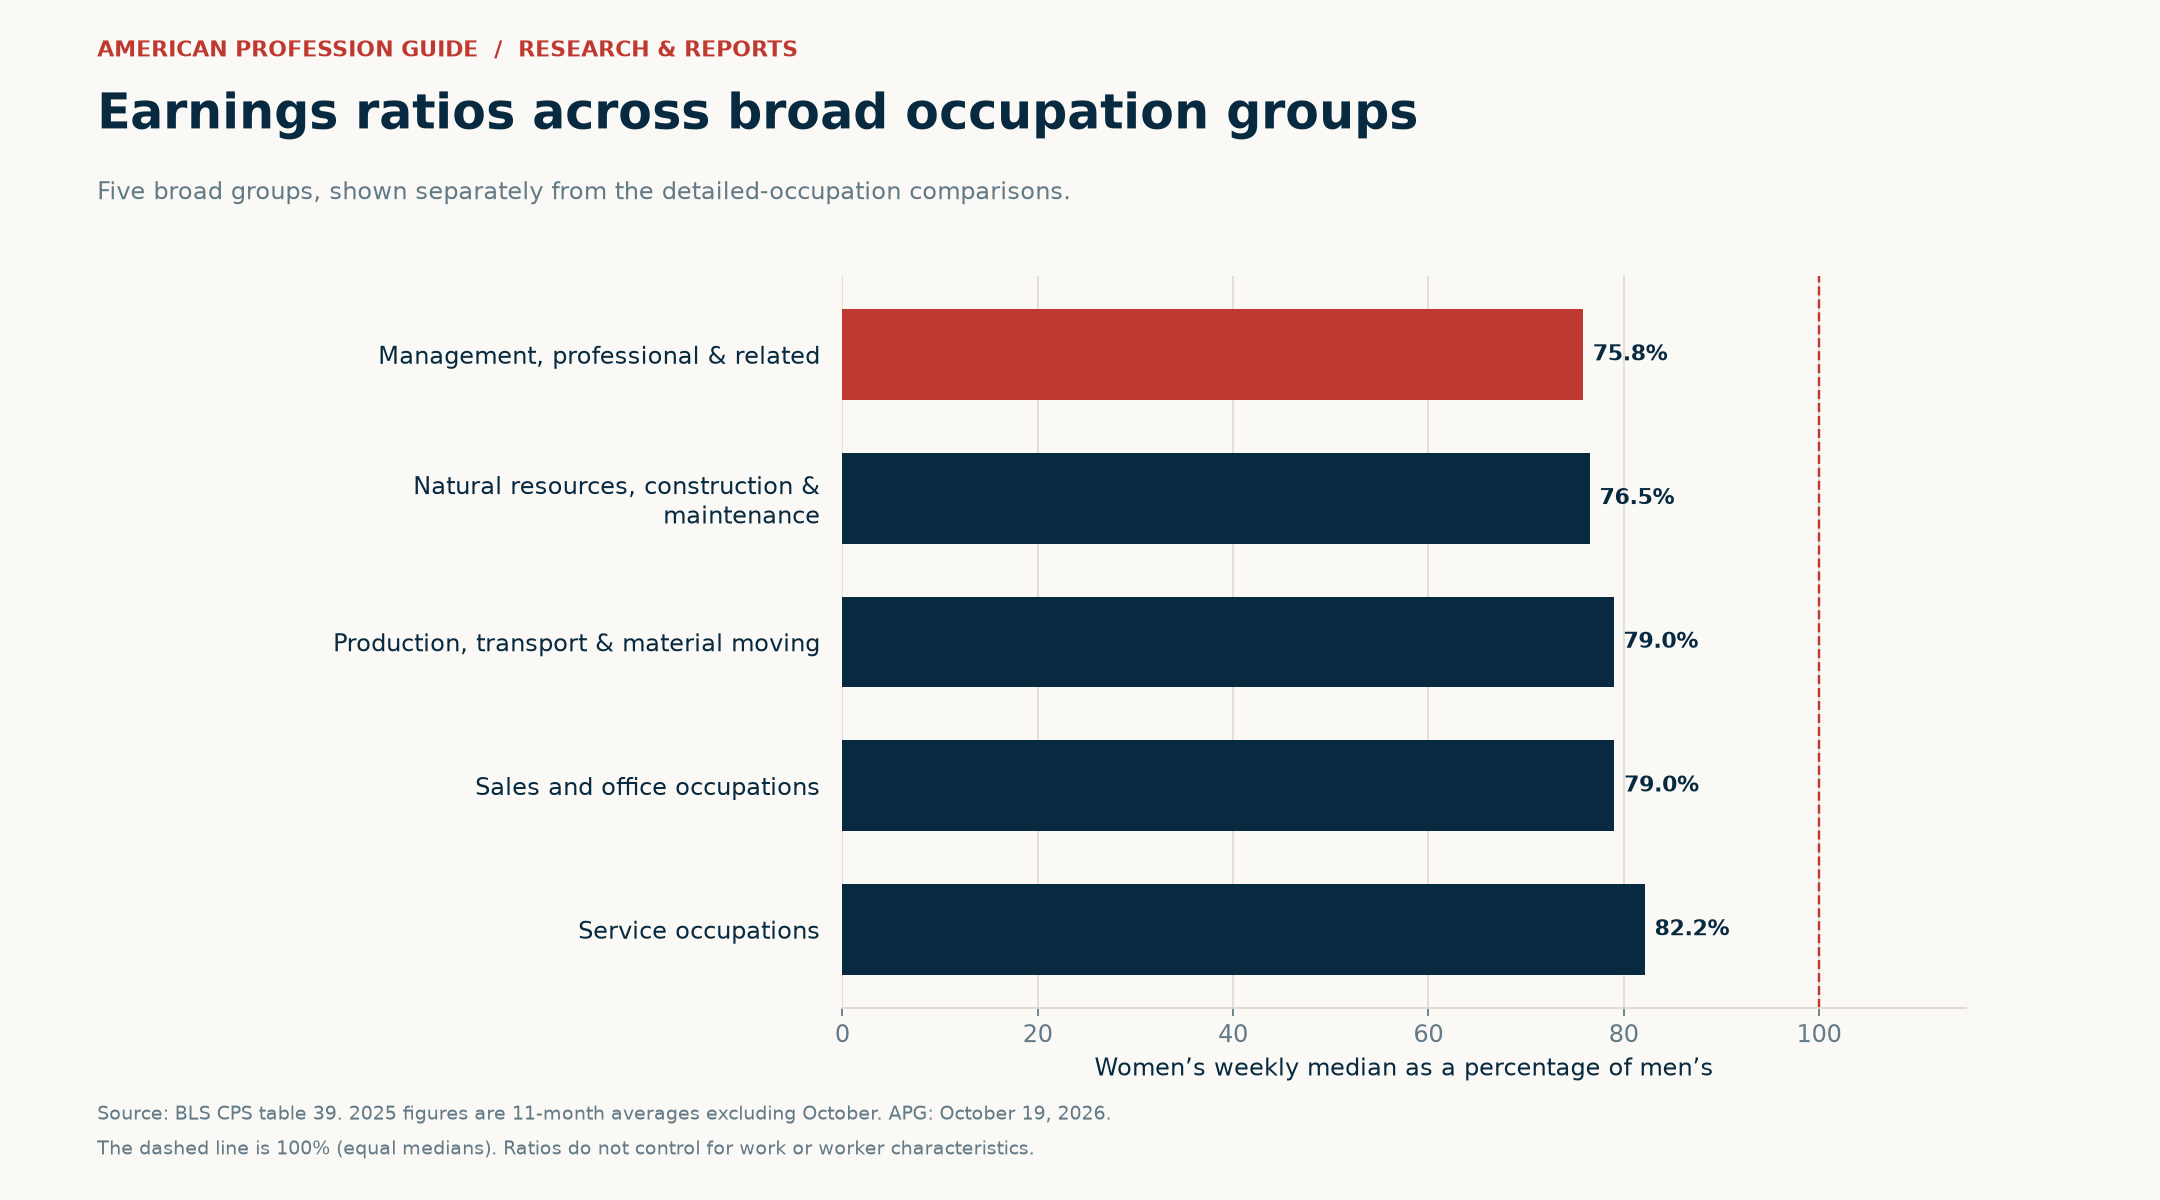
All five broad groups show women’s weekly medians below men’s. Management, professional, and related occupations have the highest dollar medians for both groups. However, they also have the lowest women-to-men ratio among these five broad categories, at 75.8%.
| Broad occupation group | Women/week | Men/week | Women ÷ men |
|---|---|---|---|
| Management, professional, and related occupations | $1,443 | $1,903 | 75.8% |
| Service occupations | $732 | $891 | 82.2% |
| Sales and office occupations | $935 | $1,183 | 79.0% |
| Natural resources, construction, and maintenance occupations | $854 | $1,116 | 76.5% |
| Production, transportation, and material moving occupations | $777 | $984 | 79.0% |
Service occupations have the highest ratio of these five groups, at 82.2%. Yet their medians are $732 for women and $891 for men. Those amounts are much lower than the management and professional group’s $1,443 and $1,903. Thus, a higher ratio and a higher earnings level are distinct outcomes.
Each broad category combines many jobs. Differences in the occupations held by women and men can affect the group medians. Even a detailed occupation title can contain several specialties and seniority levels. For that reason, a more specific title narrows the comparison without fully adjusting it.
Ten occupations with the lowest earnings ratios
Among the 83 eligible occupations, credit counselors and loan officers have the lowest women-to-men ratio, at 63.3%. Personal financial advisors follow at 68.4%. First-line supervisors of production and operating workers have a ratio of 70.0%. These are the lowest point estimates within our stated screen.
| Occupation | Women/week | Men/week | Women ÷ men |
|---|---|---|---|
| Credit counselors and loan officers | $1,108 | $1,750 | 63.3% |
| Personal financial advisors | $1,451 | $2,122 | 68.4% |
| First-line supervisors of production and operating workers | $986 | $1,408 | 70.0% |
| Retail salespersons | $741 | $1,050 | 70.6% |
| Food service managers | $910 | $1,250 | 72.8% |
| Driver/sales workers and truck drivers | $795 | $1,076 | 73.9% |
| Chief executives | $2,325 | $3,098 | 75.0% |
| Insurance sales agents | $1,087 | $1,435 | 75.7% |
| Packaging and filling machine operators and tenders | $690 | $902 | 76.5% |
| Police officers | $1,174 | $1,534 | 76.5% |
Compare percentages with dollar differences
The credit counselor and loan officer category has an estimated 177,000 women and 172,000 men working full time for wages or salaries. The $642 median difference equals 36.7% of men’s median. However, these figures do not show whether workers have the same employer, hours, experience, loan specialty, or compensation structure.
Chief executives illustrate why readers should examine both percentages and dollars. Their women-to-men ratio is 75.0%, while their weekly median difference is $773. That dollar difference exceeds the $642 in credit counseling and loan officer roles. A higher earnings base can produce a larger dollar difference alongside a smaller percentage gap.
Retail salespersons offer another scale comparison. Their medians are $741 for women and $1,050 for men, producing a 70.6% ratio and a $309 difference. The table therefore combines occupations with very different earnings levels. A single ranking cannot capture all those distinctions.
Nine occupations close to equal medians
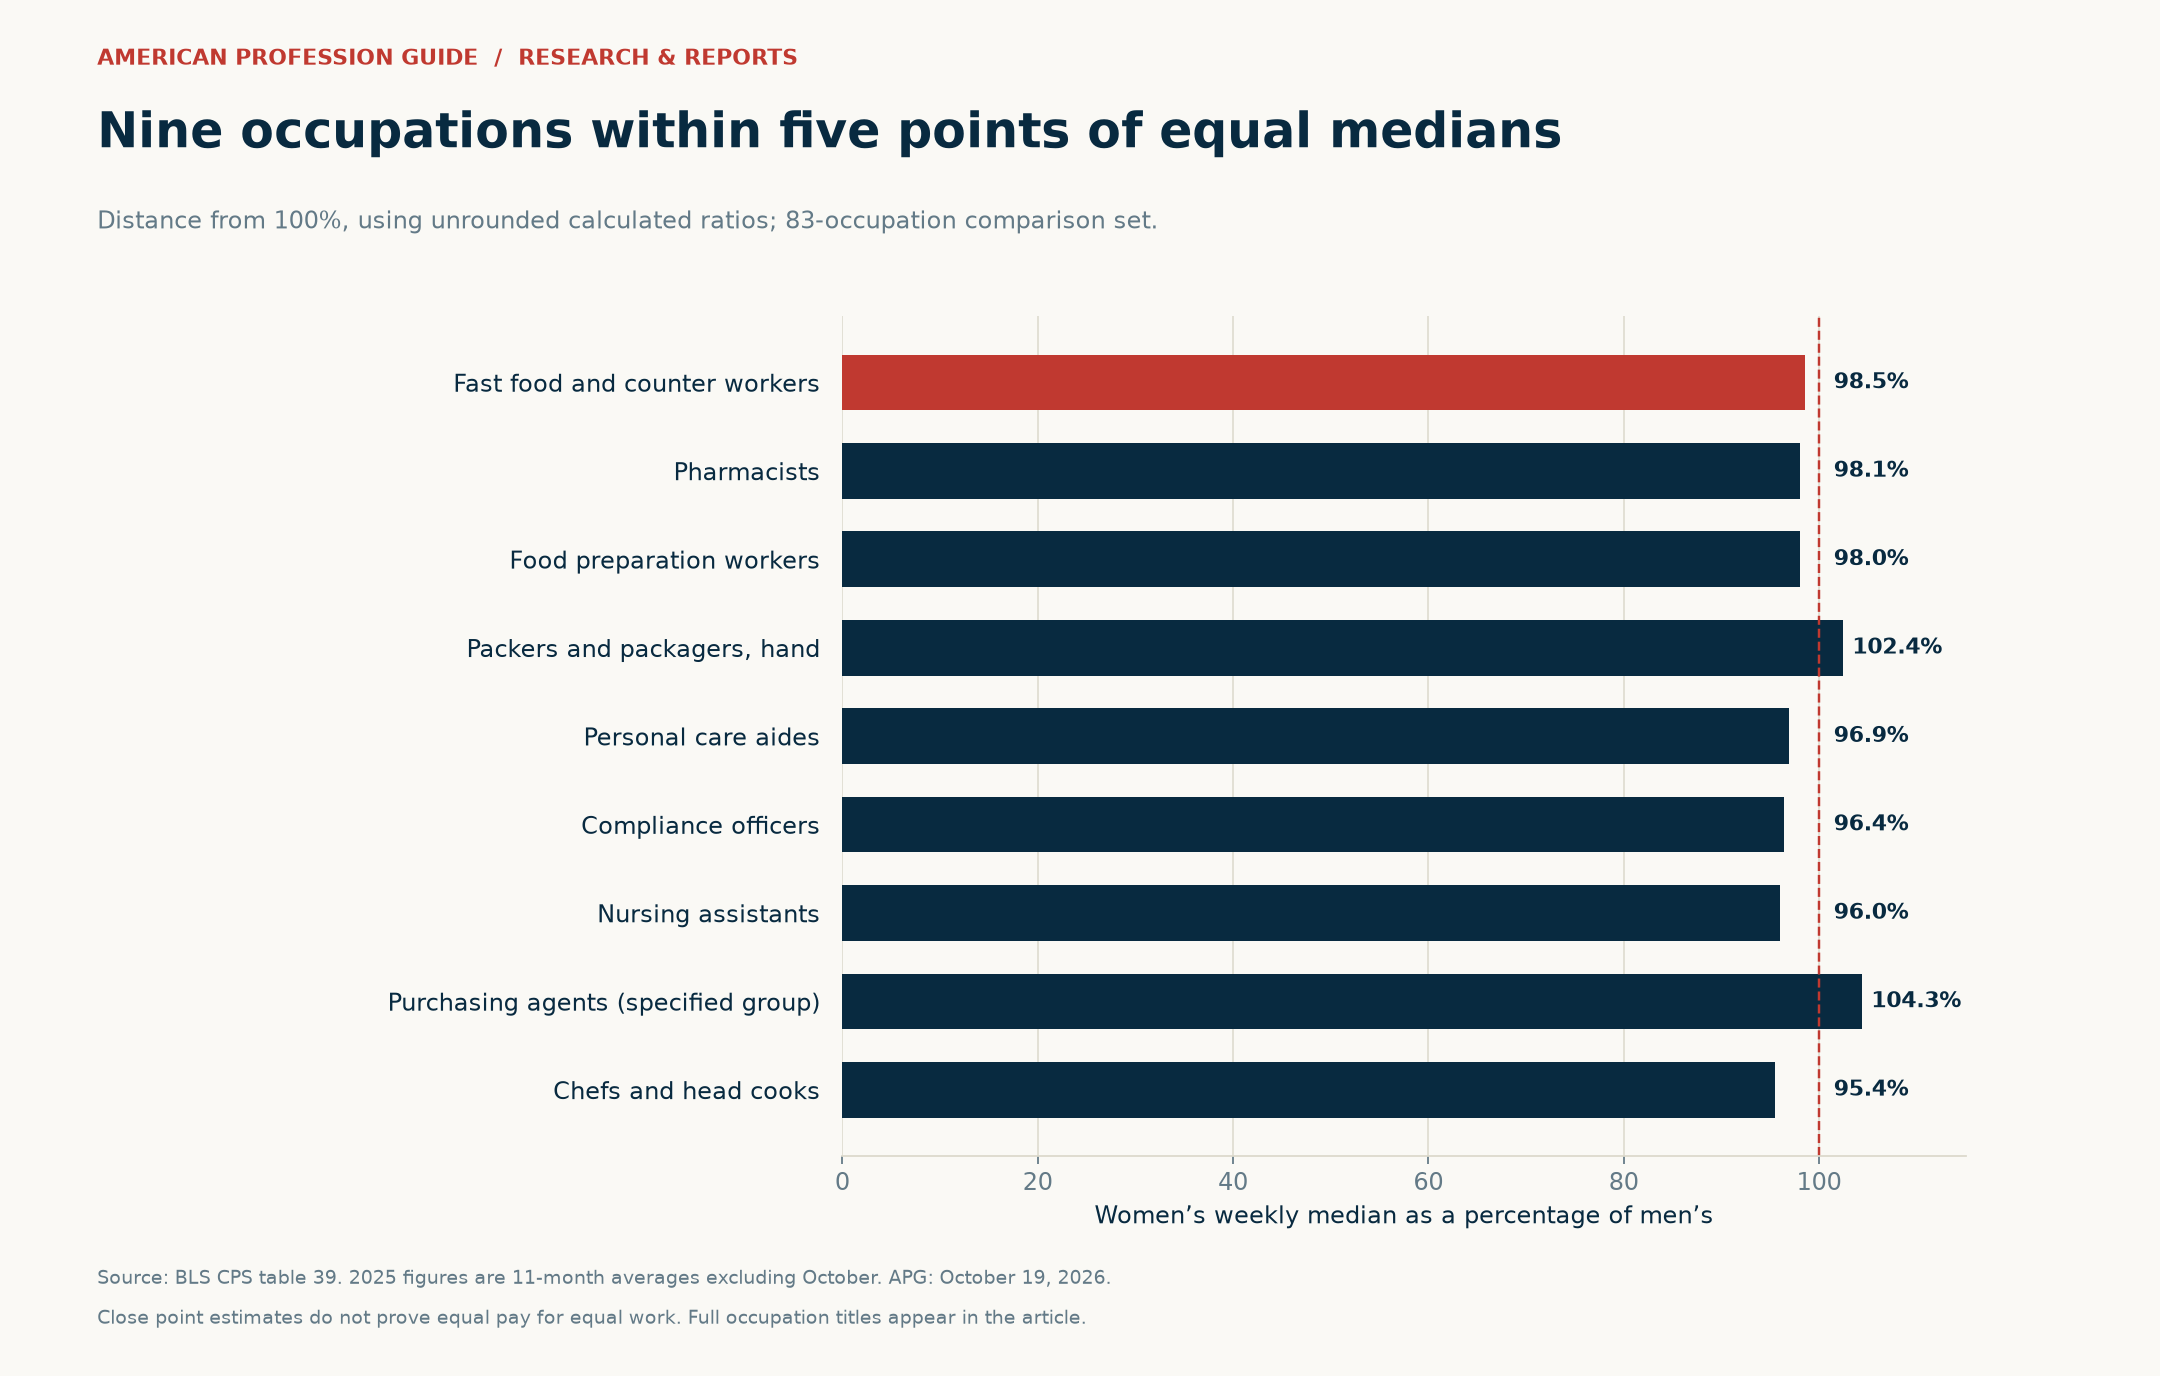
We define “near parity” as a women-to-men ratio between 95% and 105%, inclusive. Nine eligible occupations meet that rule using unrounded calculations. Fast food and counter workers are closest to 100%, at 98.5%. Pharmacists follow at 98.1%.
| Occupation | Women/week | Men/week | Women ÷ men |
|---|---|---|---|
| Fast food and counter workers | $608 | $617 | 98.5% |
| Pharmacists | $2,471 | $2,520 | 98.1% |
| Food preparation workers | $647 | $660 | 98.0% |
| Packers and packagers, hand | $724 | $707 | 102.4% |
| Personal care aides | $743 | $767 | 96.9% |
| Compliance officers | $1,495 | $1,551 | 96.4% |
| Nursing assistants | $760 | $792 | 96.0% |
| Purchasing agents, except wholesale, retail, and farm products | $1,440 | $1,380 | 104.3% |
| Chefs and head cooks | $920 | $964 | 95.4% |
Similar ratios can hide very different pay levels
The two occupations with women’s medians above men’s are hand packers and packagers, and the specified purchasing agent category. Their ratios are 102.4% and 104.3%, respectively. A ratio above 100% produces a negative gap under our formula. It does not prove an advantage for every woman in that occupation.
Pay levels vary sharply within this list. Women pharmacists have a weekly median of $2,471, compared with $608 among women working in fast food and counter service. Both occupations are near parity under our rule. Therefore, a narrow gender pay gap should not be confused with a high-pay career ranking.
The five-point cutoff is an editorial convention, not a statistical test. An occupation just outside the band is not necessarily meaningfully different from one just inside it. Moreover, we apply the cutoff to unrounded ratios so that display rounding does not change eligibility.
Six familiar careers show different earnings patterns
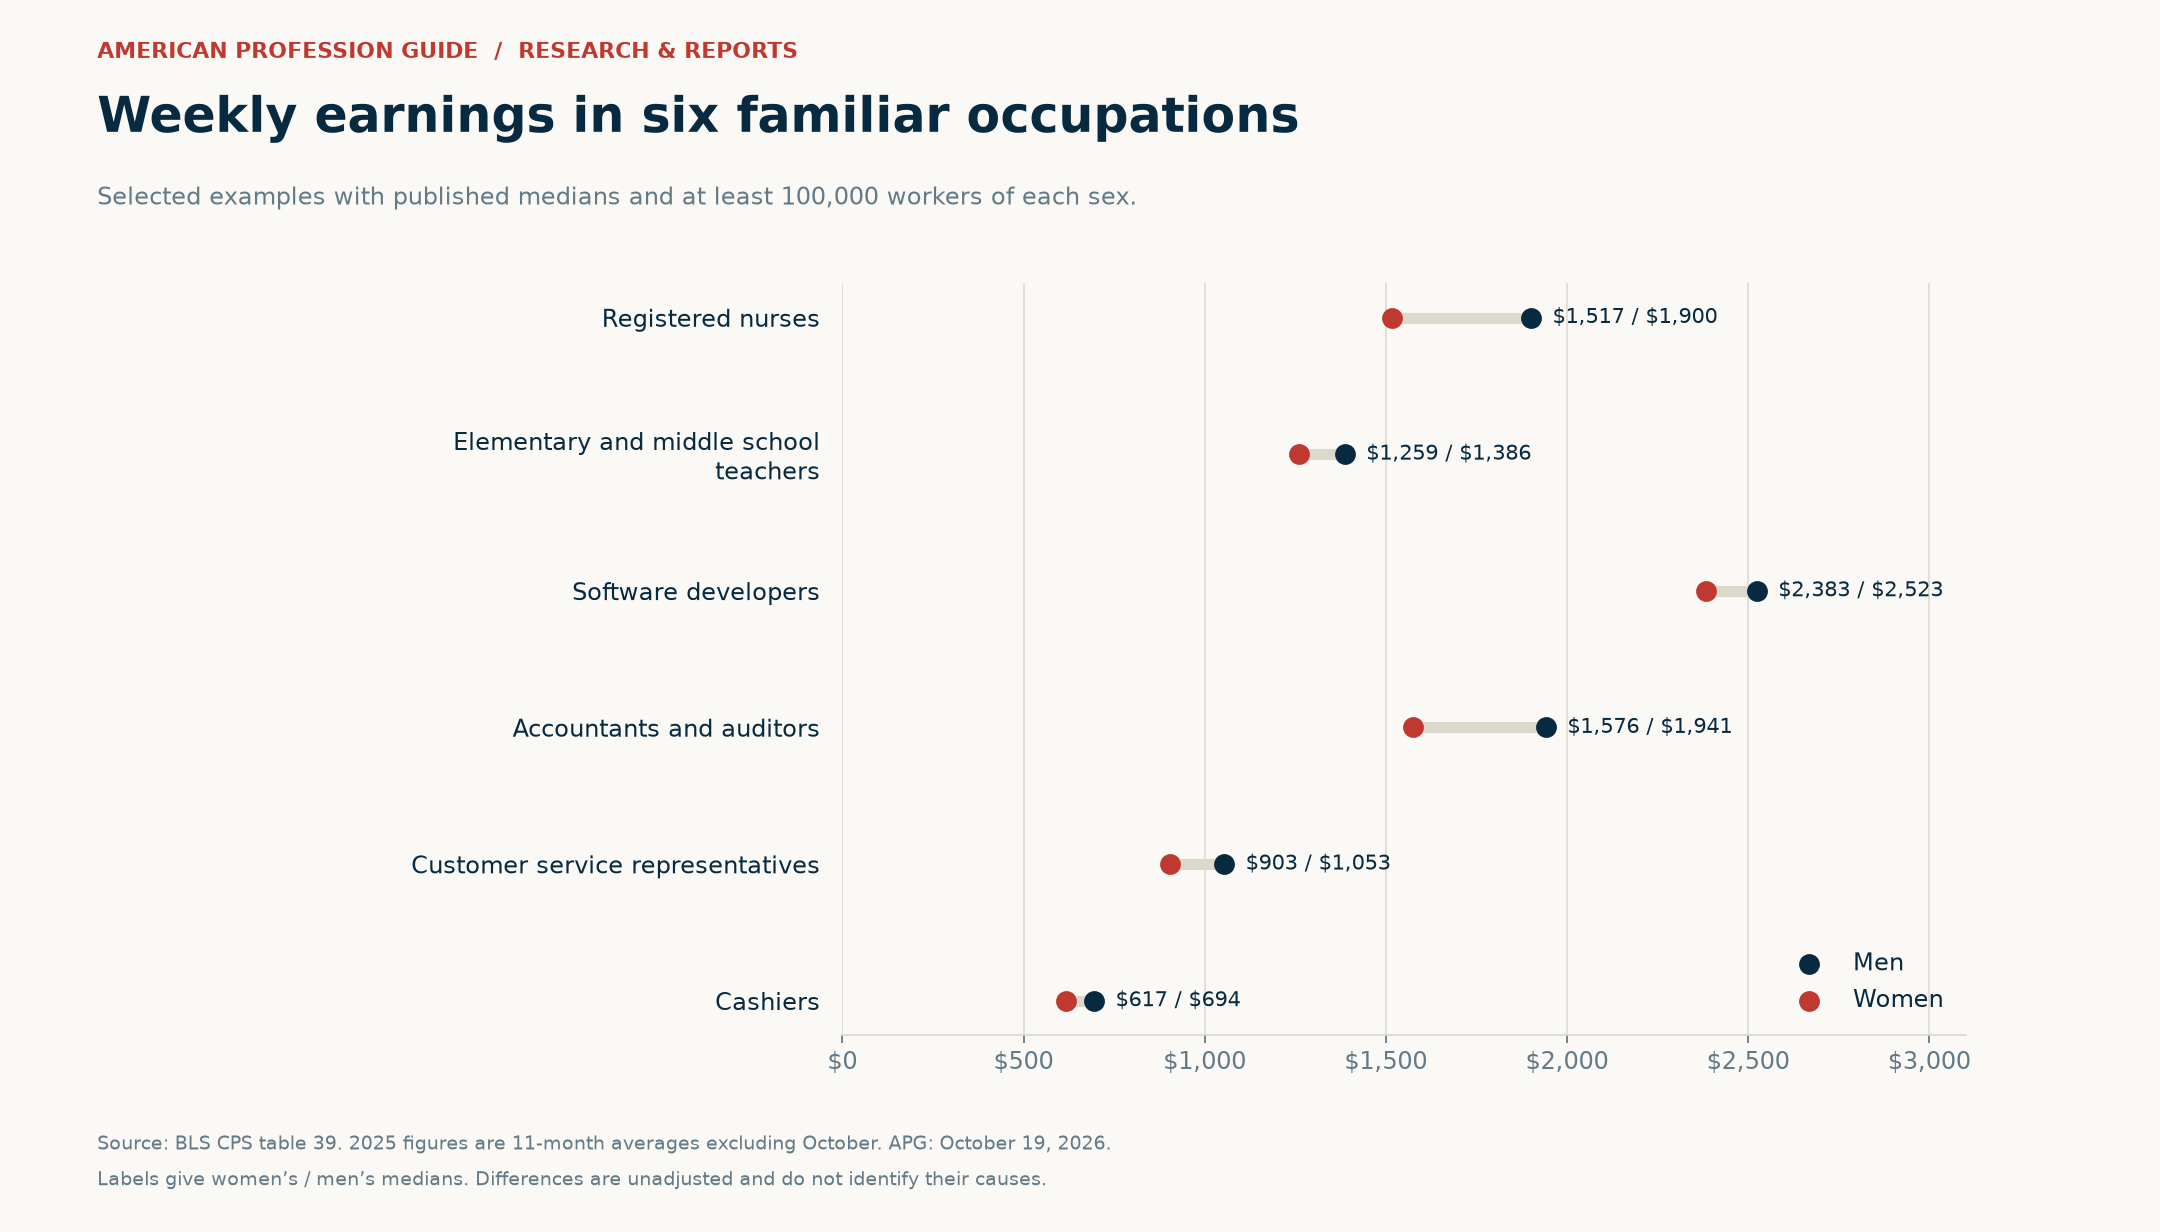
To make the figures easier to use, we selected six familiar occupations spanning health care, education, technology, business, and customer-facing work. These examples are not a separate top-six ranking. Each meets the same publication and workforce thresholds as the full comparison set.
| Selected occupation | Women/week | Men/week | Women ÷ men |
|---|---|---|---|
| Registered nurses | $1,517 | $1,900 | 79.8% |
| Elementary and middle school teachers | $1,259 | $1,386 | 90.8% |
| Software developers | $2,383 | $2,523 | 94.5% |
| Accountants and auditors | $1,576 | $1,941 | 81.2% |
| Customer service representatives | $903 | $1,053 | 85.8% |
| Cashiers | $617 | $694 | 88.9% |
Registered nurses have a women-to-men ratio of 79.8%, with medians of $1,517 and $1,900. The source estimates 2.494 million women and 402,000 men in the full-time wage and salary category. Those workforce totals show that the two groups differ greatly in size, even within one occupation.
Software developers have higher medians for both groups and a narrower percentage difference. Their medians are $2,383 for women and $2,523 for men, a ratio of 94.5%. Meanwhile, elementary and middle school teachers have a ratio of 90.8%. These comparisons provide context without explaining why the differences exist.
How to use the findings without overstating them

An occupation-level gender pay gap can identify a question worth investigating. It cannot, by itself, establish unequal pay for equal work, discrimination, or the absence of discrimination. The table does not control for age, experience, hours above the full-time threshold, specialty, seniority, employer, industry, or location.
Likewise, listing those factors does not establish how much of a difference they explain. That would require a suitable dataset and a separate statistical model. Our report does not estimate an adjusted gap. It also does not claim that every observed difference disappears after adjustment.
For career research, combine this report with other measures. Our job growth and annual openings study describes projected demand. Our careers without a bachelor’s degree analysis compares typical entry education, pay, and openings. Each addresses a different part of a career decision.
Location matters as well. The APG salary purchasing power study examines regional wages and prices. However, its wage data are not directly interchangeable with this CPS weekly earnings series. Keep the year, worker coverage, geography, and occupation definitions attached to every comparison.
Methodology, coverage, and limitations
We retrieved BLS CPS table 39 on October 19, 2026. Its displayed update date is February 20, 2026. We retained the original occupation labels and published worker estimates. The source expresses worker counts in thousands and weekly medians in dollars. We preserved missing medians rather than treating them as zero.
- Identify detailed categories. We used the table’s indentation hierarchy to retain terminal occupation rows and exclude national totals and parent summaries. This produces 565 detailed categories, including combined titles and “other” groups.
- Check earnings availability. Only 132 detailed categories have both men’s and women’s published medians. A dash means no data or failure to meet publication criteria, not zero earnings.
- Apply the comparison screen. We require both published medians and at least 100,000 estimated workers of each sex. This yields 83 eligible occupations.
- Calculate consistently. We divide women’s median by men’s, multiply by 100, and calculate the dollar difference separately. Rankings and eligibility use unrounded calculations; displays generally show one decimal place.
- Keep summaries separate. National and broad-group results use their own published medians. We do not average detailed occupation ratios to recreate those summaries.
Why the comparison set has limits
BLS does not publish medians when the estimated worker base is below 50,000. Our 100,000 threshold is a stricter editorial screen. Crucially, these are population estimates, not counts of survey respondents. The larger threshold does not guarantee precision or remove sampling uncertainty.
In addition, the screen also limits coverage. It excludes occupations with small workforces, highly uneven representation, or unavailable medians. Therefore, the 83 occupations are not a random sample of careers and cannot describe every occupation. The count of 81 with higher men’s medians applies only to this comparison set.
Finally, CPS estimates come from a sample survey and can change because of sampling and other errors. We did not calculate margins of error or statistical significance. In addition, the missing October observations make the 2025 figures unusual. Readers should not use this article to infer a trend from another year’s annual average.
For further detail, consult the BLS usual weekly earnings technical note and the source table’s footnotes. Our occupation categories follow CPS reporting and should not be assumed to match one-for-one with the separate Employment Projections or Occupational Employment and Wage Statistics systems.
Download the data and cite this study
Download the occupational gender pay gap dataset (CSV). The file contains all 565 detailed categories, the two worker bases and medians, calculated ratios and dollar differences, eligibility flags, the source URL, and the data period. Empty cells indicate unavailable source values.
Suggested citation: American Profession Guide, “Gender Pay Gap by Occupation: What 83 U.S. Career Comparisons Show,” 2026 research edition. Analysis of U.S. Bureau of Labor Statistics, Current Population Survey table 39, 2025 eleven-month averages excluding October. Accessed October 19, 2026.
Researchers and publishers may reuse APG’s original charts with attribution and a link to this study. Please retain the BLS source, the eleven-month data-period note, and the comparison threshold. The featured and interior editorial illustrations were generated with AI. All statistical findings come from the linked federal source and the calculations described above.


