




The graduate degree salary premium in 2026 looks substantial at the median. Advanced-degree workers earned $1,932 a week, compared with $1,602 for bachelor’s-only workers. Yet those national figures hide wide, overlapping earnings ranges. They describe groups of workers; they do not predict the raise you would receive from a particular program.
Checked October 26, 2026. Our analysis uses the Bureau of Labor Statistics release published October 21. Its observations cover the third quarter of 2026. We calculate the median gap, compare earnings percentiles and provide a blank program-comparison worksheet. The practical question is how much evidence you need before committing time and money to graduate study.
Graduate degree salary premium in 2026: the $330 gap
The BLS educational-attainment table reports usual weekly earnings for full-time wage-and-salary workers aged 25 and older. “Advanced degree” combines master’s, professional and doctoral degrees. It is not a master’s-only estimate. The figures are in current dollars and are not seasonally adjusted.
Subtract $1,602 from $1,932 and the observed median gap is $330 per week. Divide $330 by the bachelor’s-only median of $1,602 and the relative difference is 20.6%, rounded to one decimal place. This is an original calculation from the published group medians. It is not an estimate of what education caused.
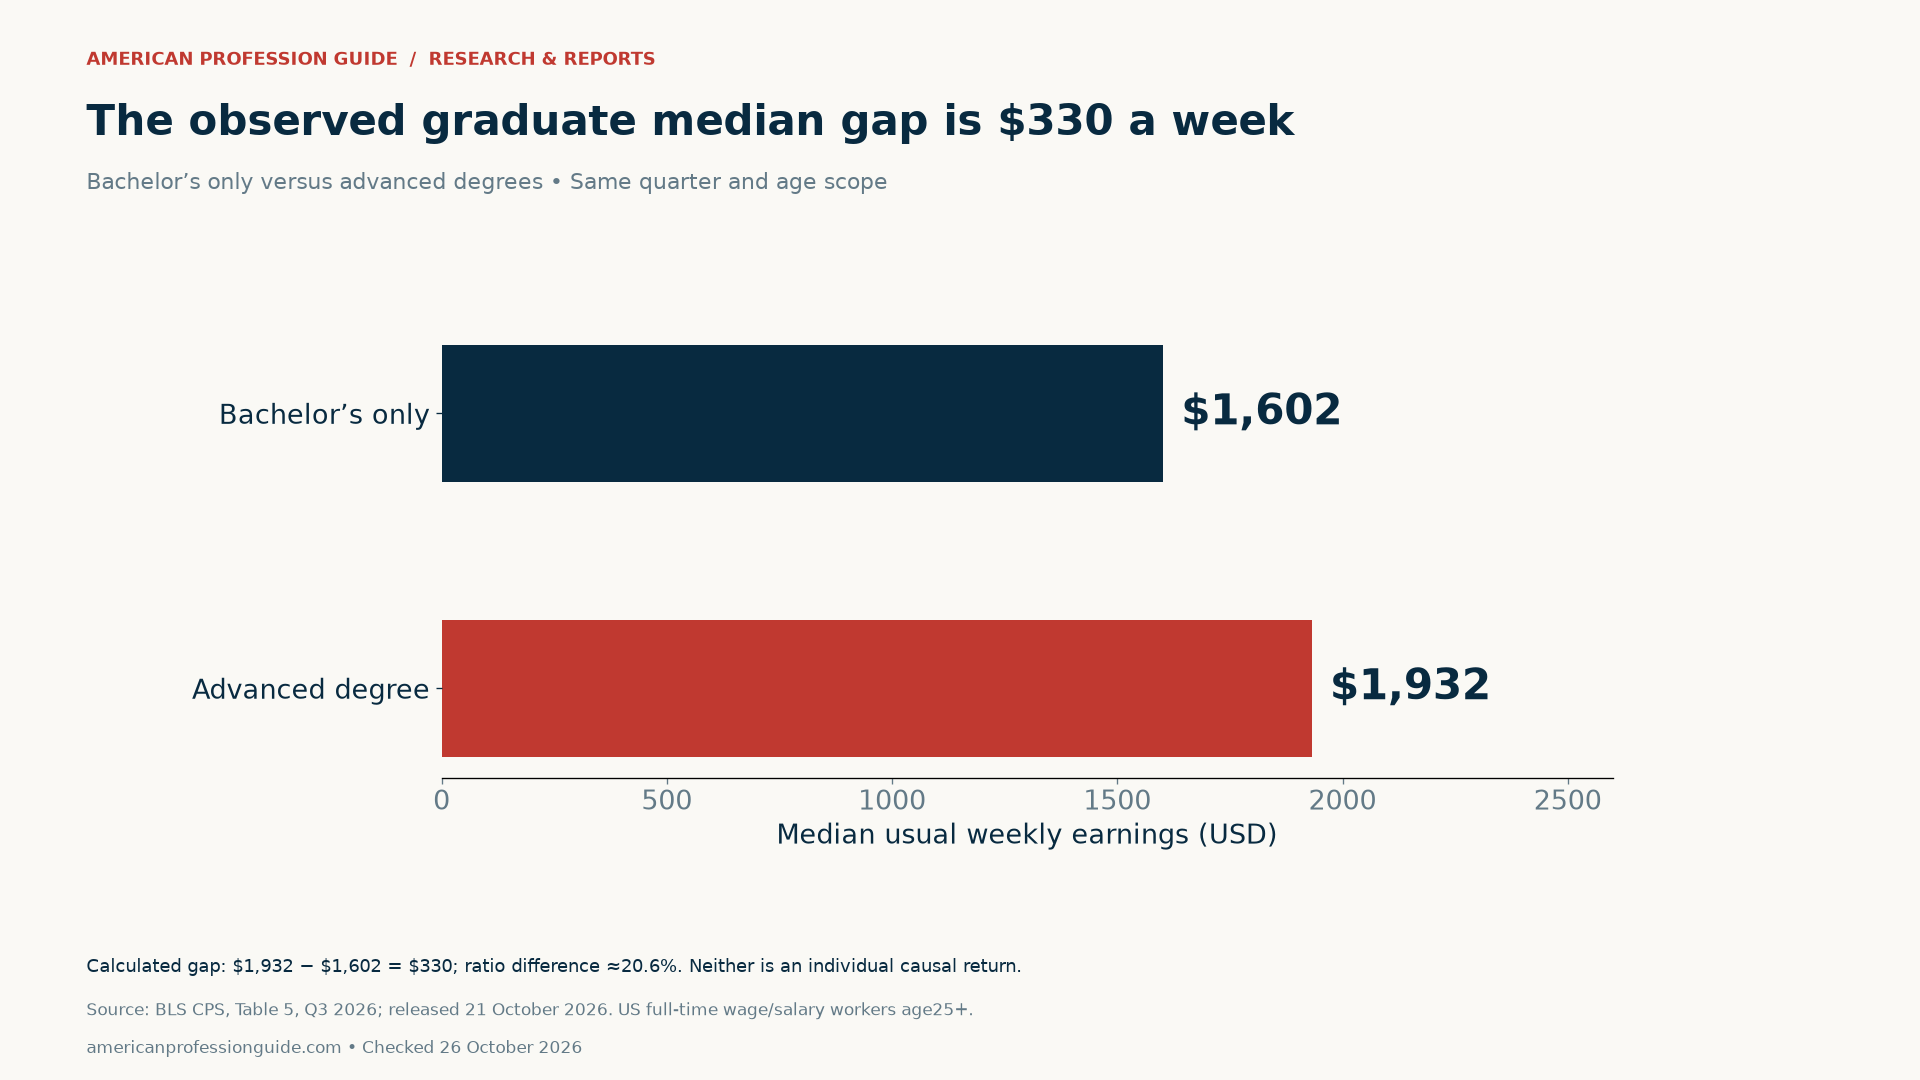
A median divides a distribution into two halves. It does not describe every person in that group. Differences in occupation, experience, working hours, location and the people who pursue each qualification can all matter when comparing earnings. This table does not hold those factors constant or follow the same worker before and after graduation.
Where the middle half of earnings overlaps
For bachelor’s-only workers, the 25th percentile was $1,091 and the 75th percentile was $2,396. For advanced-degree workers, those boundaries were $1,369 and $2,913. The two middle-half ranges therefore overlap from $1,369 to $2,396 a week. Their intersection is $1,027 wide.
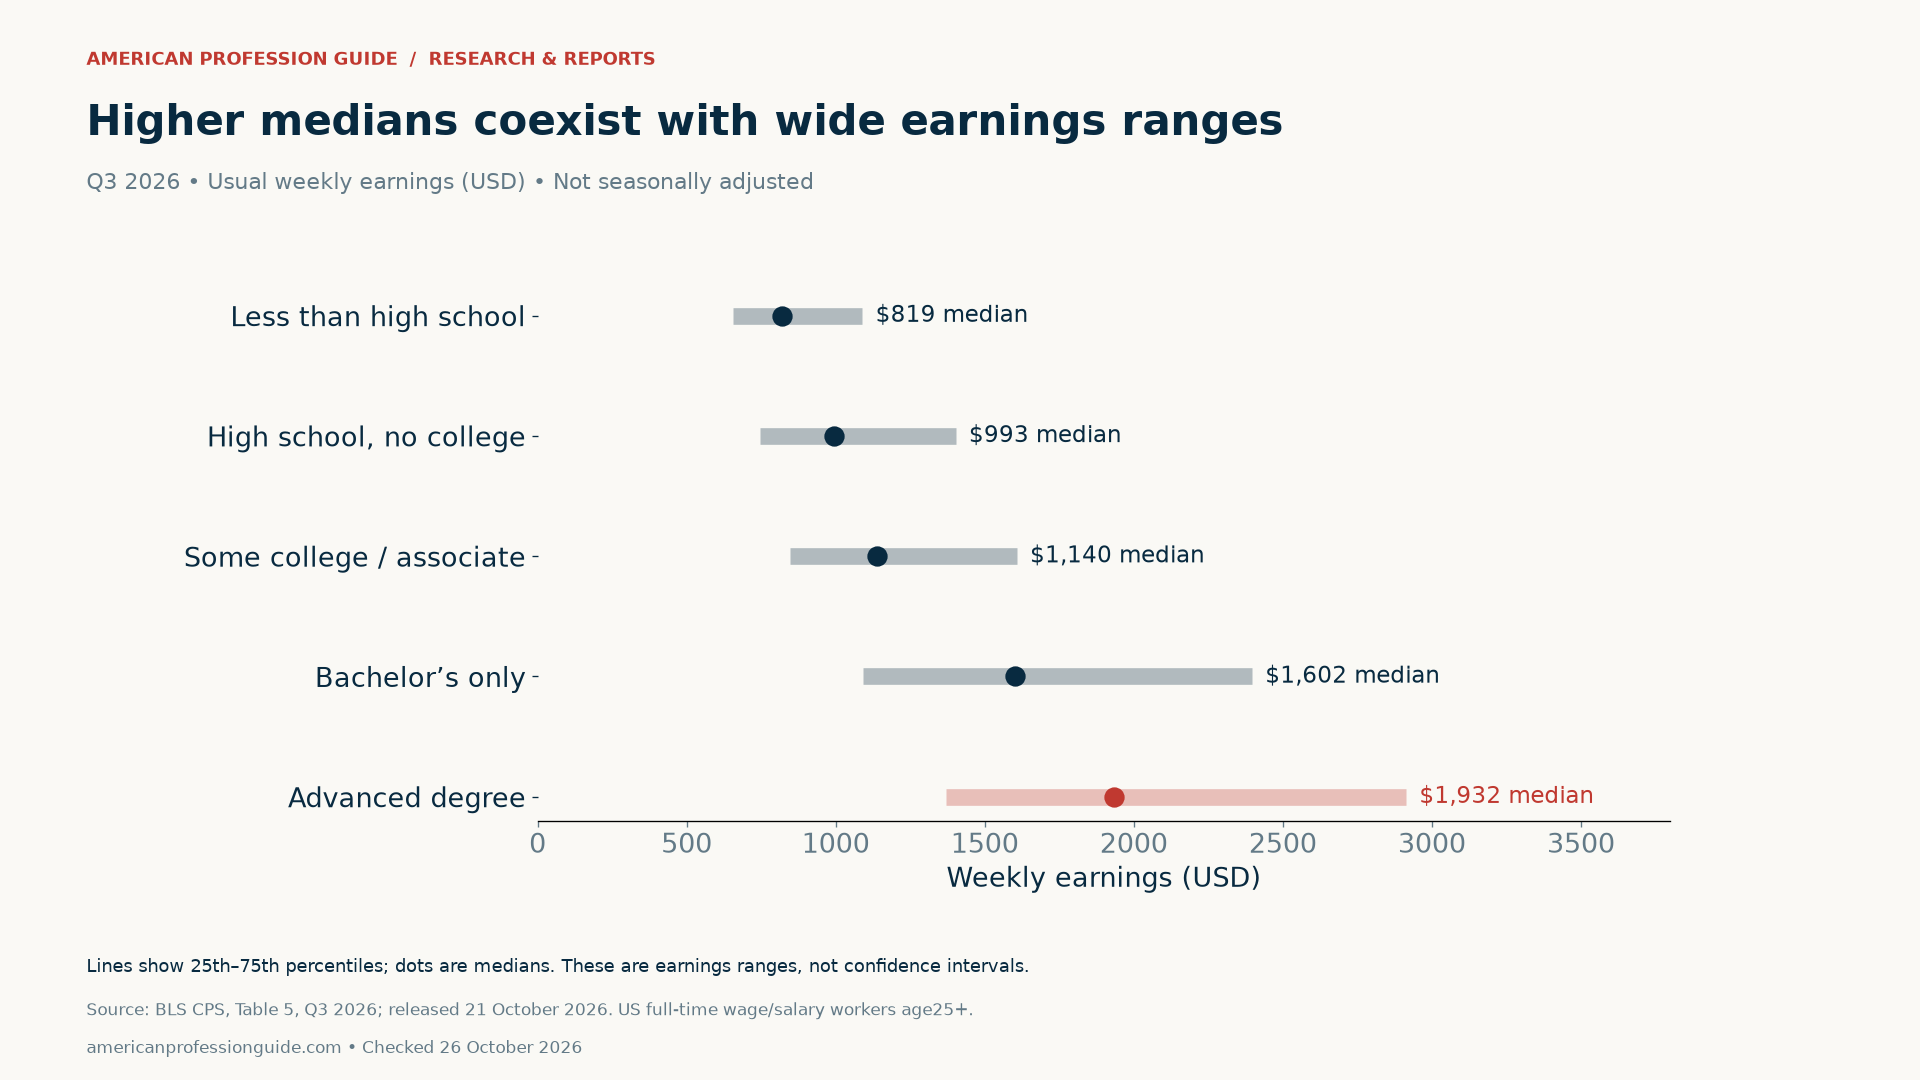
| Highest educational attainment | 25th percentile | Median | 75th percentile |
|---|---|---|---|
| Less than high school | $655 | $819 | $1,089 |
| High school, no college | $747 | $993 | $1,402 |
| Some college or associate degree | $848 | $1,140 | $1,607 |
| Bachelor’s only | $1,091 | $1,602 | $2,396 |
| Advanced degree | $1,369 | $1,932 | $2,913 |
The overlap matters because a higher group median coexists with many different earnings outcomes. However, its width does not reveal the probability that a randomly selected bachelor’s graduate earns more than a randomly selected advanced-degree holder. Quantile boundaries alone cannot supply that probability. They also cannot identify which program, occupation or employer produced the overlap.
The outer earnings bands tell the same story
The bachelor’s-only 10th and 90th percentiles were $797 and $3,645. The advanced-degree boundaries were $981 and $4,249. These broader bands overlap as well. They are not the minimum and maximum earnings in either group: observations lie below the 10th percentile and above the 90th.
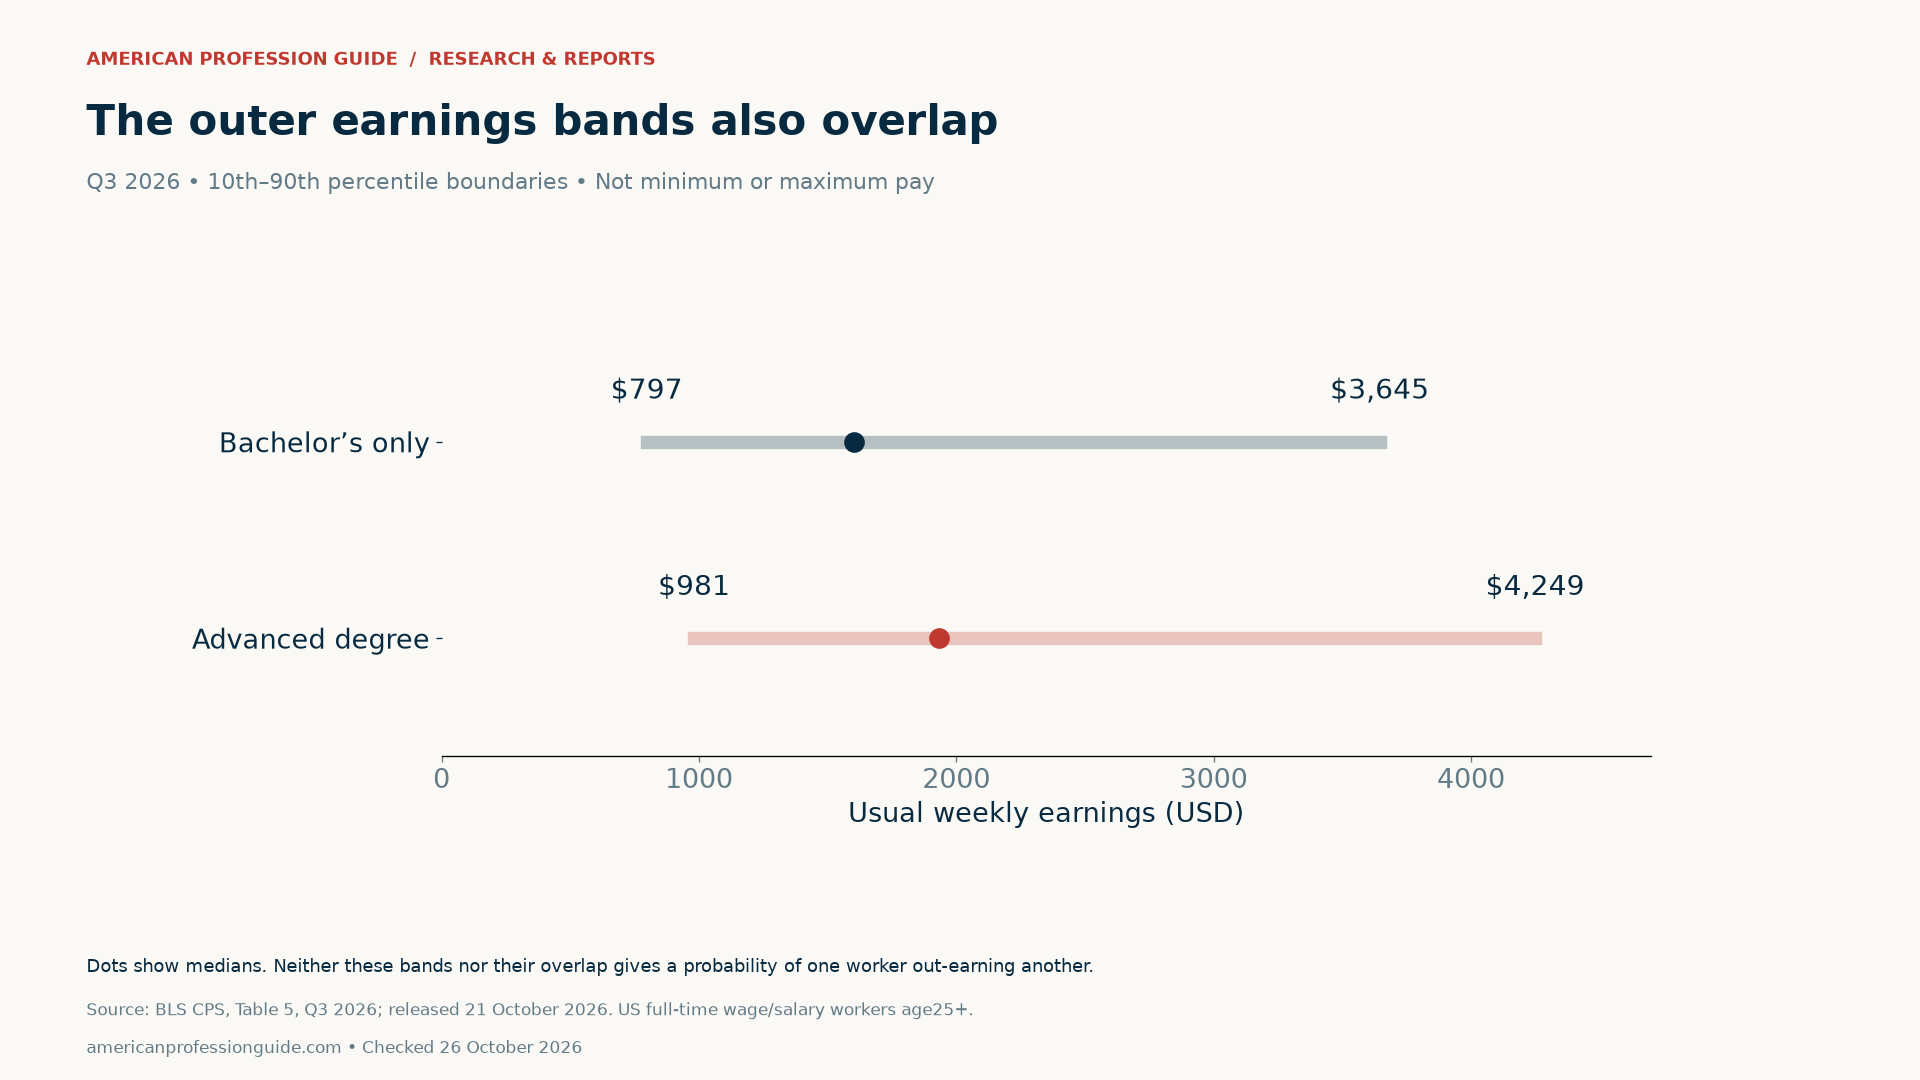
That is why a single national premium is a weak substitute for program-specific evidence. A course may support a regulated occupation, deepen expertise in an existing field or help someone change direction. Those are different decisions. Start with the work you want to do and the qualification it actually requires, rather than treating every advanced degree as the same purchase.
Variation within groups is larger than the median gap
We also subtract the 25th percentile from the 75th percentile. The resulting middle-half width is $1,305 for bachelor’s-only workers and $1,544 for advanced-degree workers. Both widths exceed the $330 difference between the two medians. These measures share dollar units but answer different questions: within-group spread and between-group median difference.
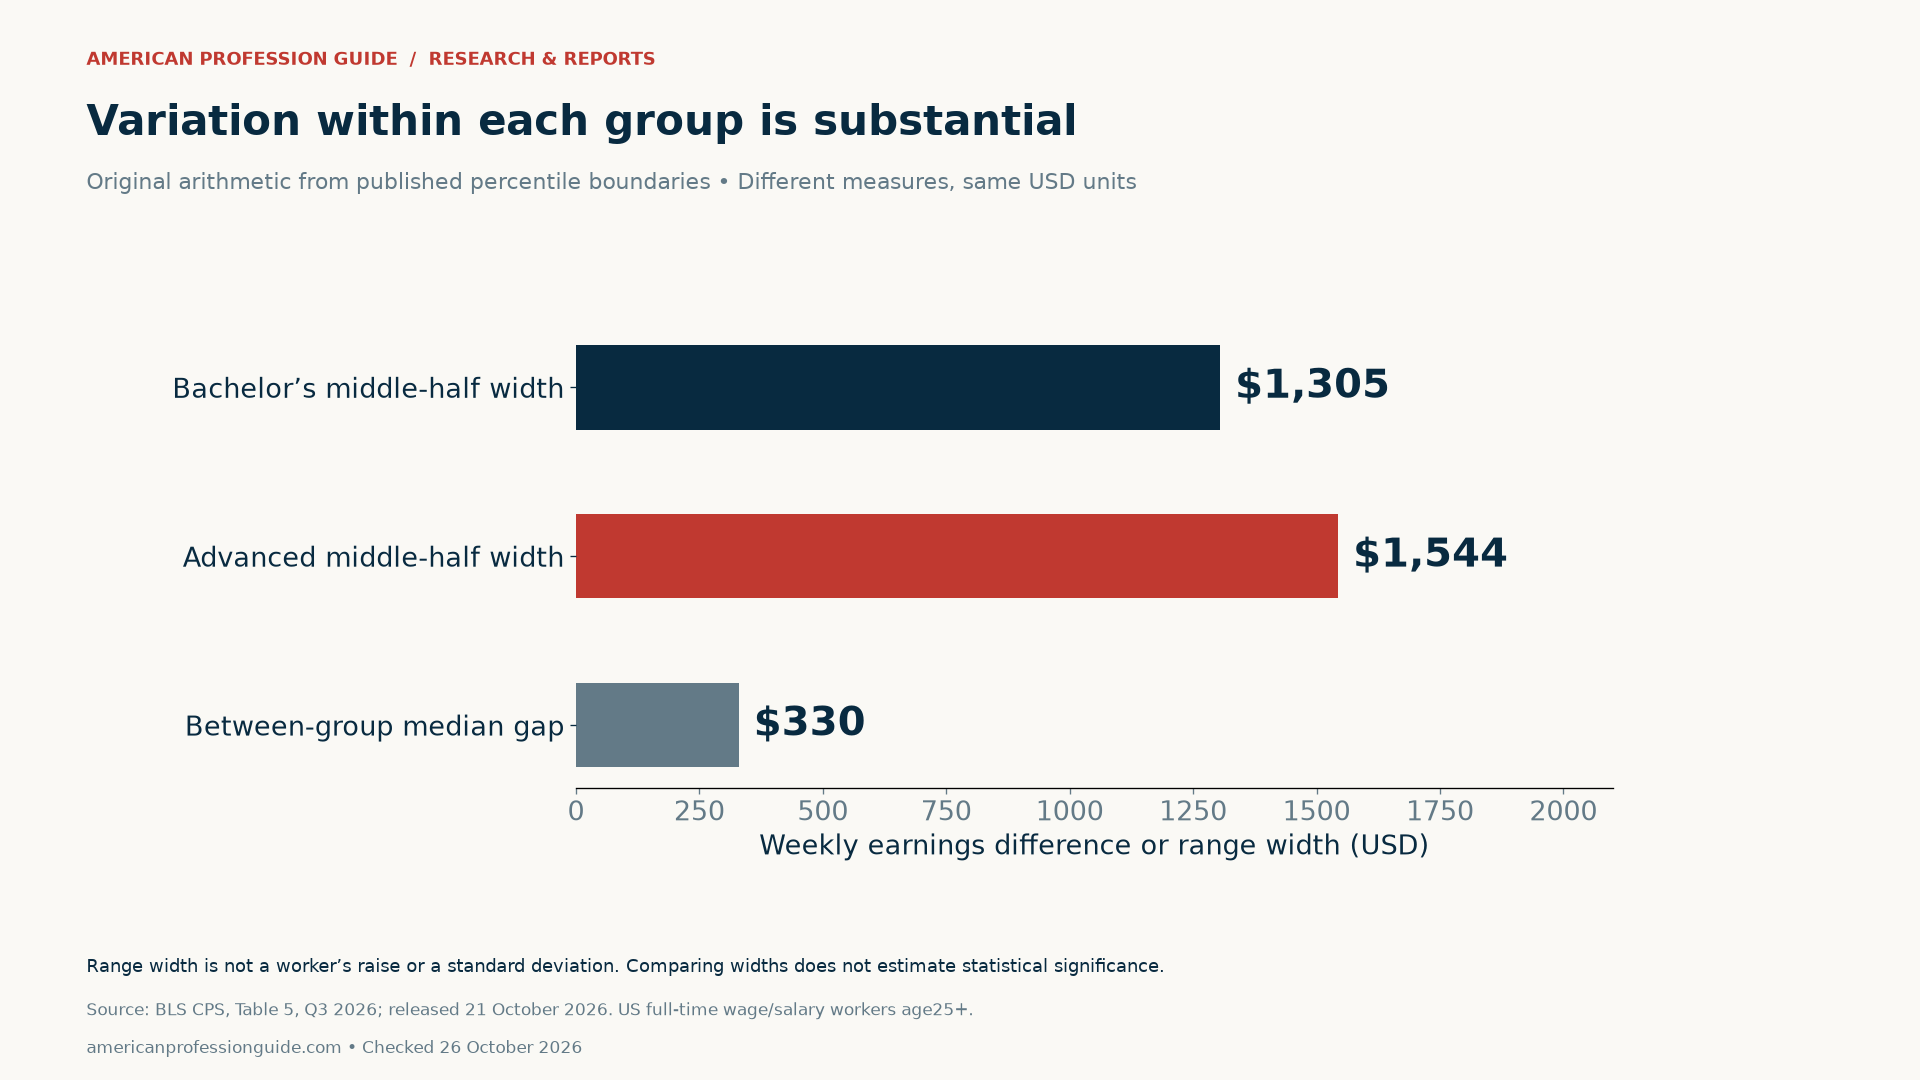
For an individual decision, compare the relevant occupation, location and experience level. Ask a program for its outcome definition, cohort size, completion rate and follow-up period. Check whether reported pay covers all graduates, employed respondents or only people who supplied earnings. A missing denominator is a reason to ask another question, not to assume the strongest interpretation.
Our research on careers without a bachelor’s degree offers another route to compare. Our metro purchasing-power study explains why location also changes the meaning of a pay figure. Neither substitutes for the entry requirements and current opportunities in your chosen field.
Build a cost case before assuming a pay benefit

An honest comparison includes more than the tuition headline. Record fees, financing costs, the study schedule and any earnings you expect to forgo. In the invented example below, tuition is $20,000, fees $2,000, financing costs $3,000 and foregone earnings $15,000. The assumed resource cost totals $40,000. These are illustrative inputs, not typical U.S. program costs.
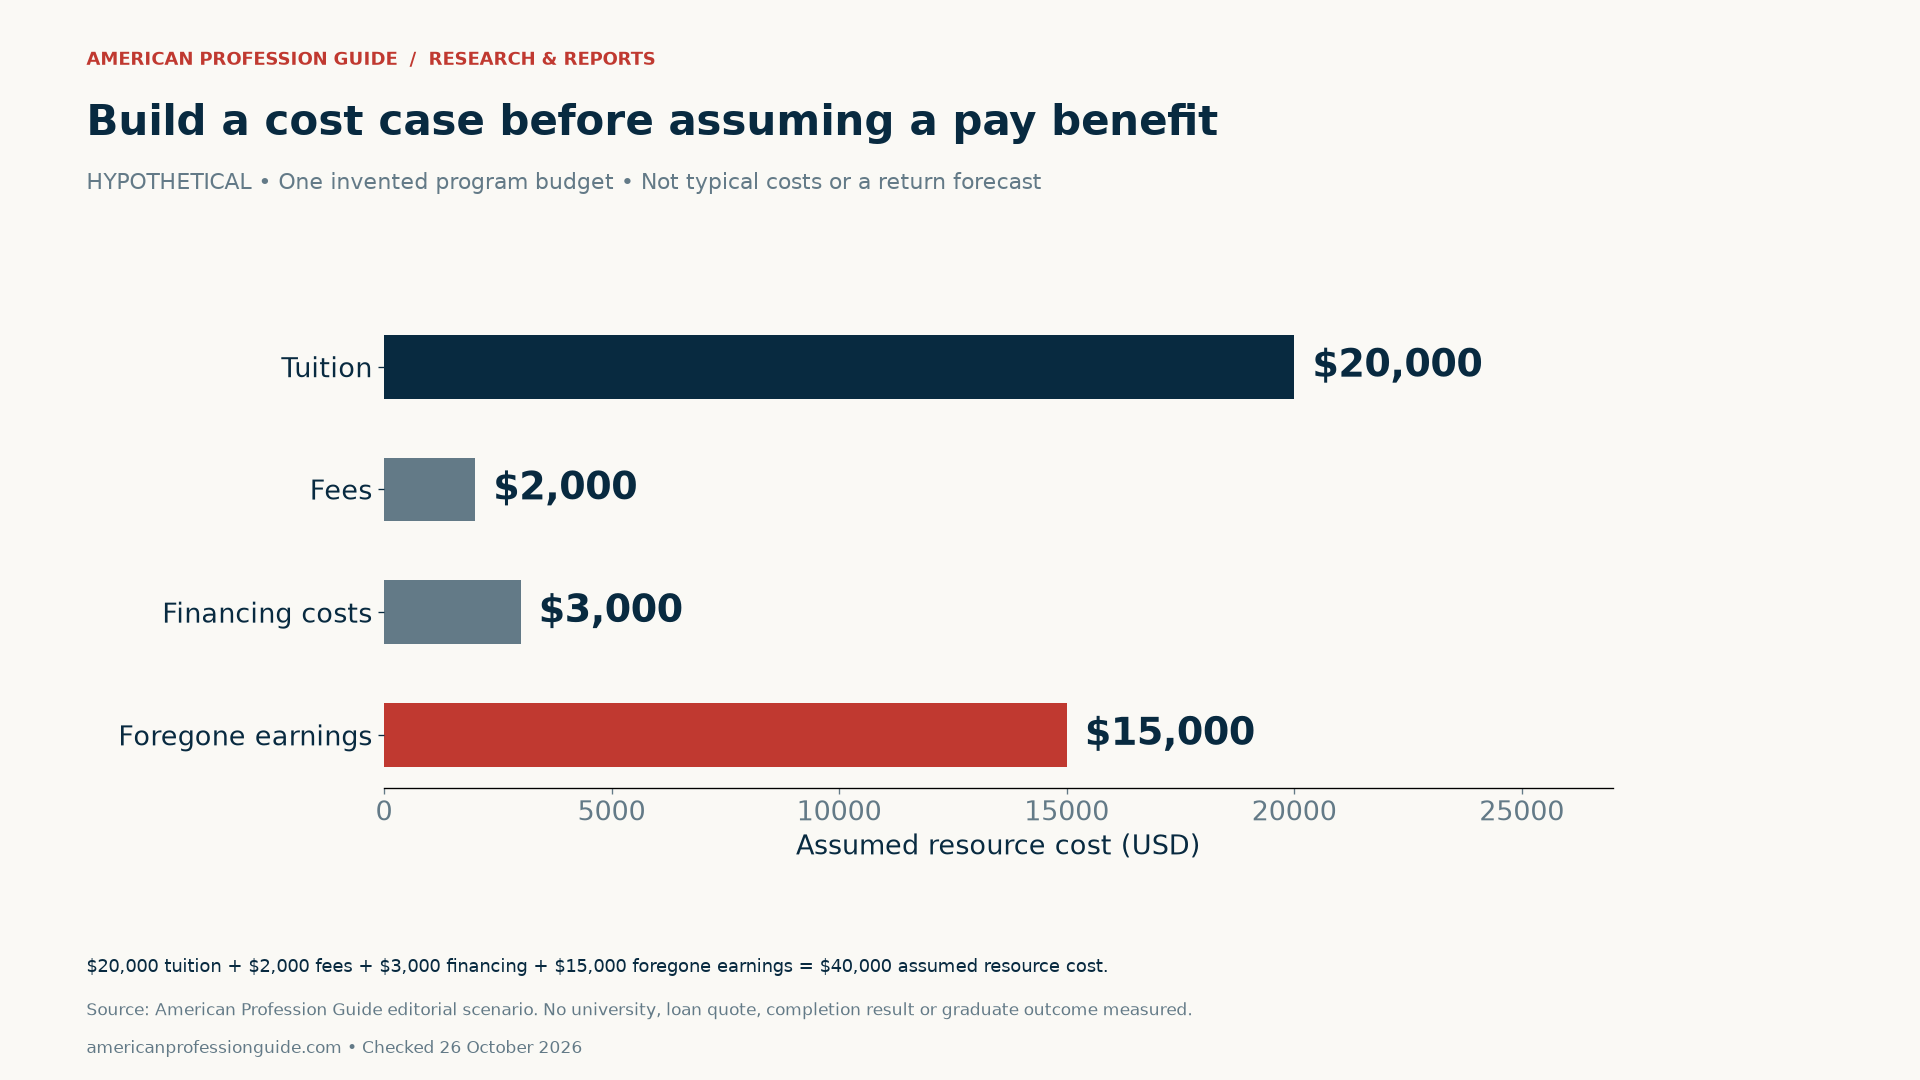
Replace every assumption with documented figures for the programs you are considering. Record employer support and grants separately, including their conditions. Then examine schedule compatibility, completion evidence and the qualification’s role in the occupation. Do not divide this invented cost by the national $330 median gap and present the answer as a personal payback period. The earnings comparison does not estimate your additional earnings.
Methodology, scope and downloadable data
We transcribed the five mutually exclusive educational-attainment rows in BLS Table 5 and checked that their percentile values increase in order. We excluded the all-workers total and the overlapping “bachelor’s degree and higher” aggregate from our five-group display. The source reports estimated worker populations in thousands; these are weighted population estimates, not interview sample sizes.
The BLS technical note defines full-time workers here as those who usually work at least 35 hours at their sole or principal job. Earnings are before taxes and other deductions and include usual overtime, commissions and tips. The series excludes self-employed workers, both incorporated and unincorporated. For people with more than one job, the earnings measure concerns the main job.
Weekly earnings can be reported as weekly equivalents. Multiplying by 52 would not turn this table into observed annual earnings, a contract salary or starting pay. The analysis also does not estimate an inflation-adjusted trend, field-specific premium, statistical significance or causal effect. The release date and the reference quarter are kept separate throughout.
Download the graduate earnings source table (CSV) to reproduce the figures. The blank graduate program comparison worksheet (CSV) helps record costs, outcome definitions and missing evidence. It contains no real student information or measured program outcomes.
Suggested citation: American Profession Guide, “Graduate Degree Salary Premium in 2026: Why Median Pay Hides a Wide Overlap,” checked October 26, 2026. Credit the U.S. Bureau of Labor Statistics for Q3 2026 observations and this report for the arithmetic, charts and comparison worksheet. Preserve the population, period and non-causal limitations when reusing a figure.


