






The disability employment rate 2026 headline needs two perspectives. October’s employment-to-population ratio for Americans with disabilities aged 16–64 was 39.9%. The corresponding ratio for people without disabilities was 75.3%. Our subtraction gives a 35.4-percentage-point gap, even while the first series remained near its record.
That contrast can guide better questions about access to work. It cannot grade an employment service or predict one person’s prospects. This report pairs three charts with a proposed outcome framework and four free CSV downloads. The service tools are blank templates; we have not evaluated a provider or collected client records.
Disability employment rate 2026: read the denominator
Kessler Foundation and the University of New Hampshire’s November 6 nTIDE release reports October employment for ages 16–64. September’s ratios were 40.3% and 75.0%, respectively. Thus, the cross-group gap rose descriptively from 34.7 to 35.4 points. We have not tested whether that movement is statistically significant.
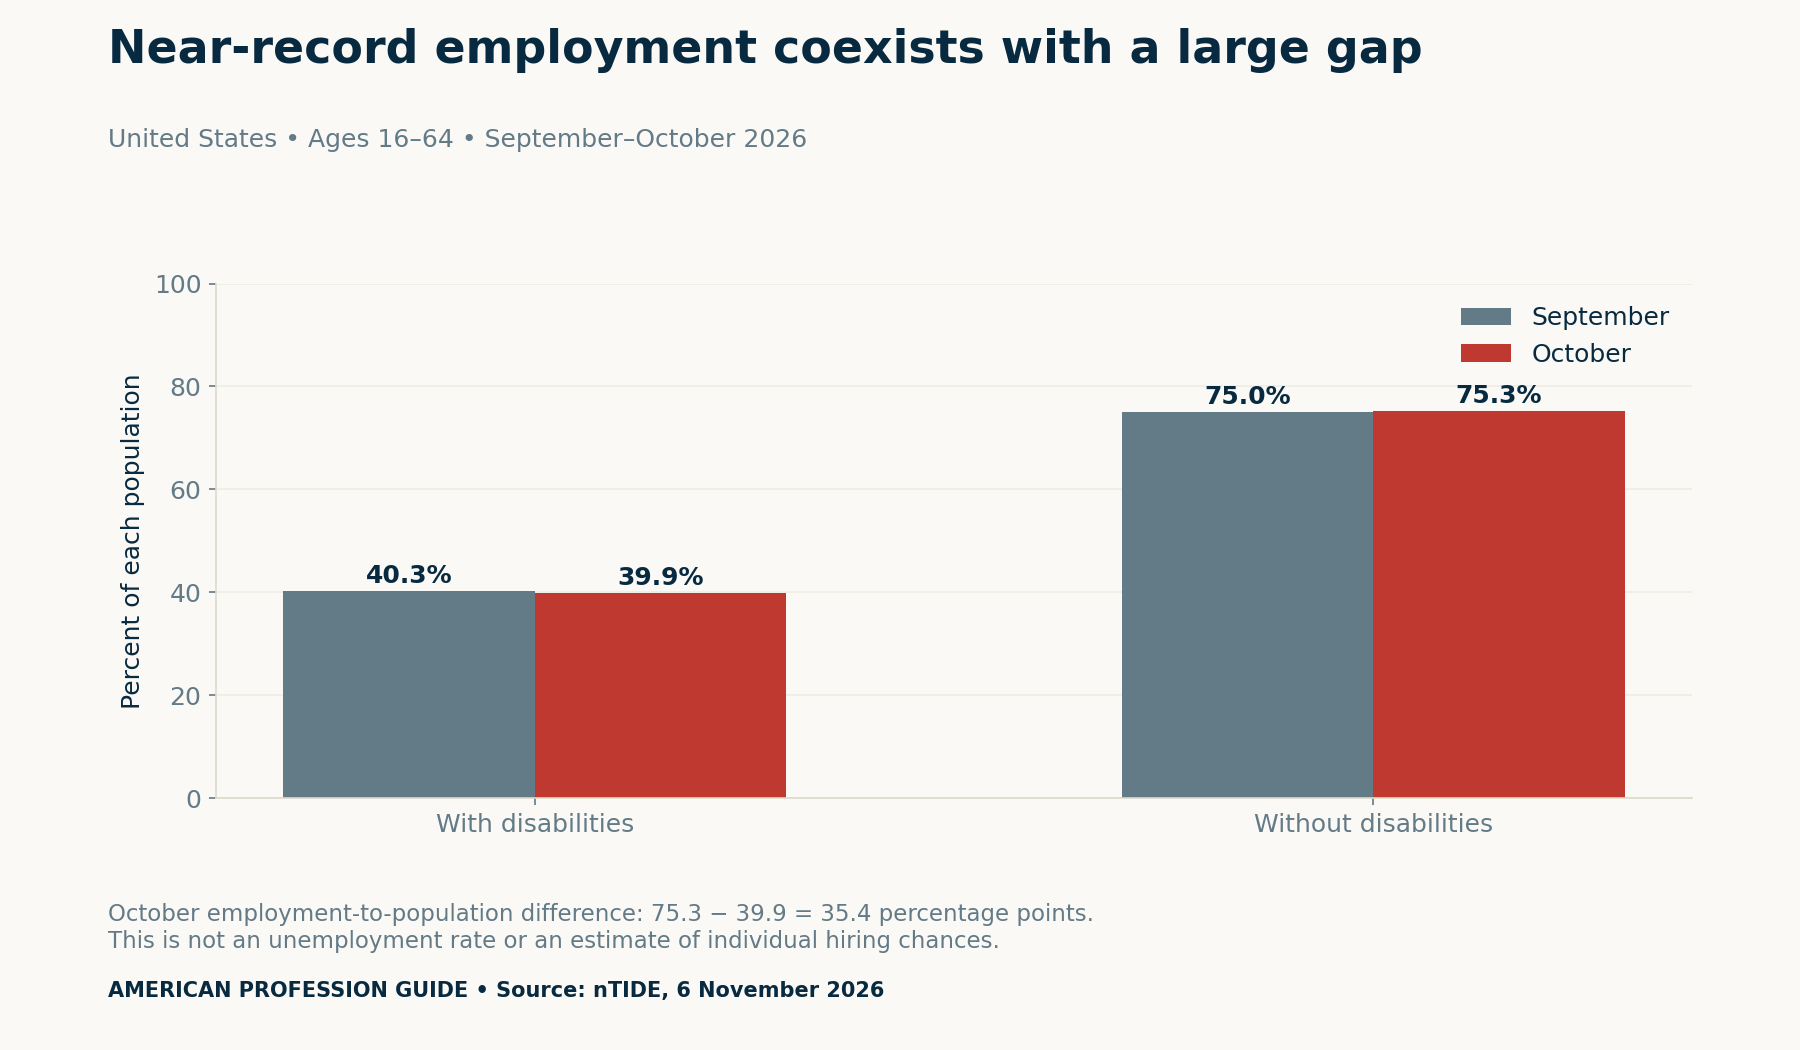
The BLS definition of the employment-population ratio divides employed people by the civilian noninstitutional population. Unemployment uses a different denominator: the labor force. Therefore, subtracting the employment ratio from 100 does not produce the unemployment rate. People outside the labor force remain in the population denominator.
For example, a reader comparing services should first ask whether a published percentage refers to all residents, referred clients or people who completed an interview. Those are different groups. A percentage without that context can sound more precise than the underlying claim.
Employment and participation measure different things
nTIDE also reports labor force participation: 43.3% for people with disabilities and 78.3% for those without, compared with September’s 43.8% and 78.1%. Participation includes employed people and unemployed people in the labor force. It is not the share receiving a job offer.
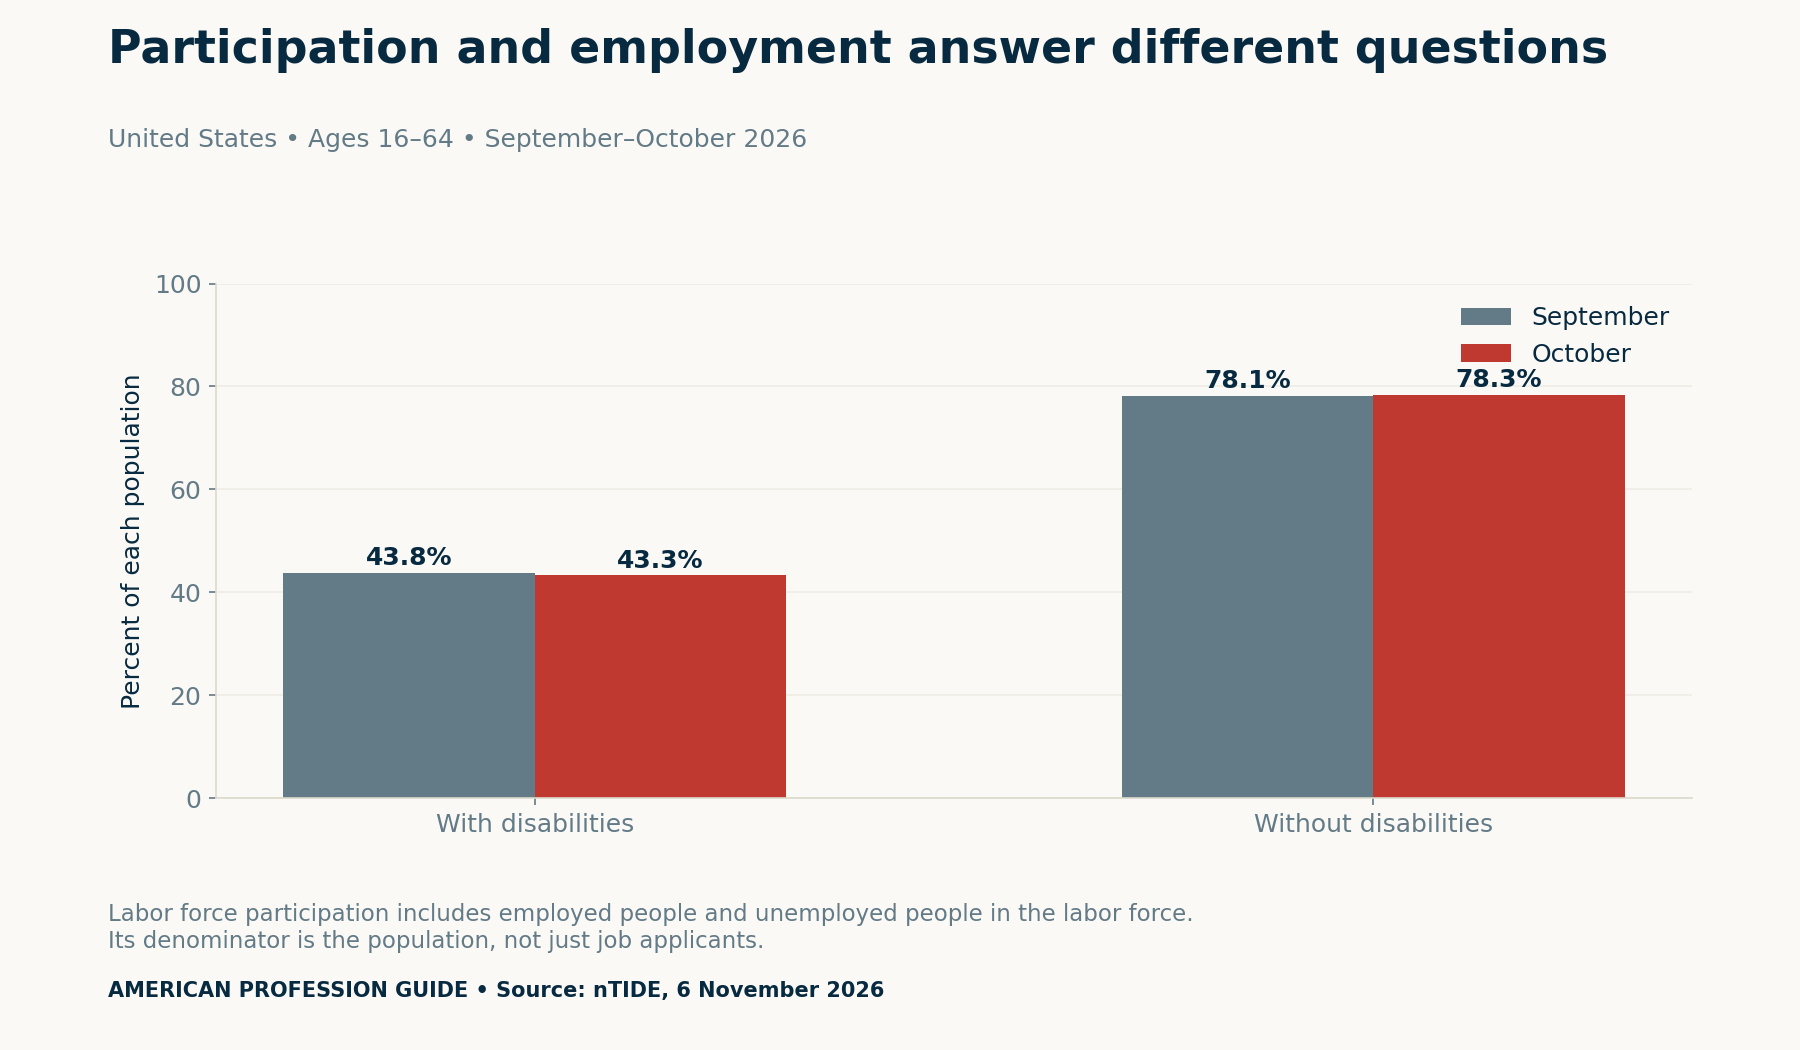
The BLS disability-data overview explains that the CPS covers the civilian noninstitutional population. Its general coverage begins at age 16; this article consistently uses nTIDE’s narrower 16–64 group. Do not mix an all-adult figure into this comparison without explaining the change in age coverage.
In practical reporting, keep the measure’s full name alongside the population. A chart title that says only “employment success” hides too much. Instead, name the outcome, the people included and the period observed.
Small monthly changes are not a causal explanation
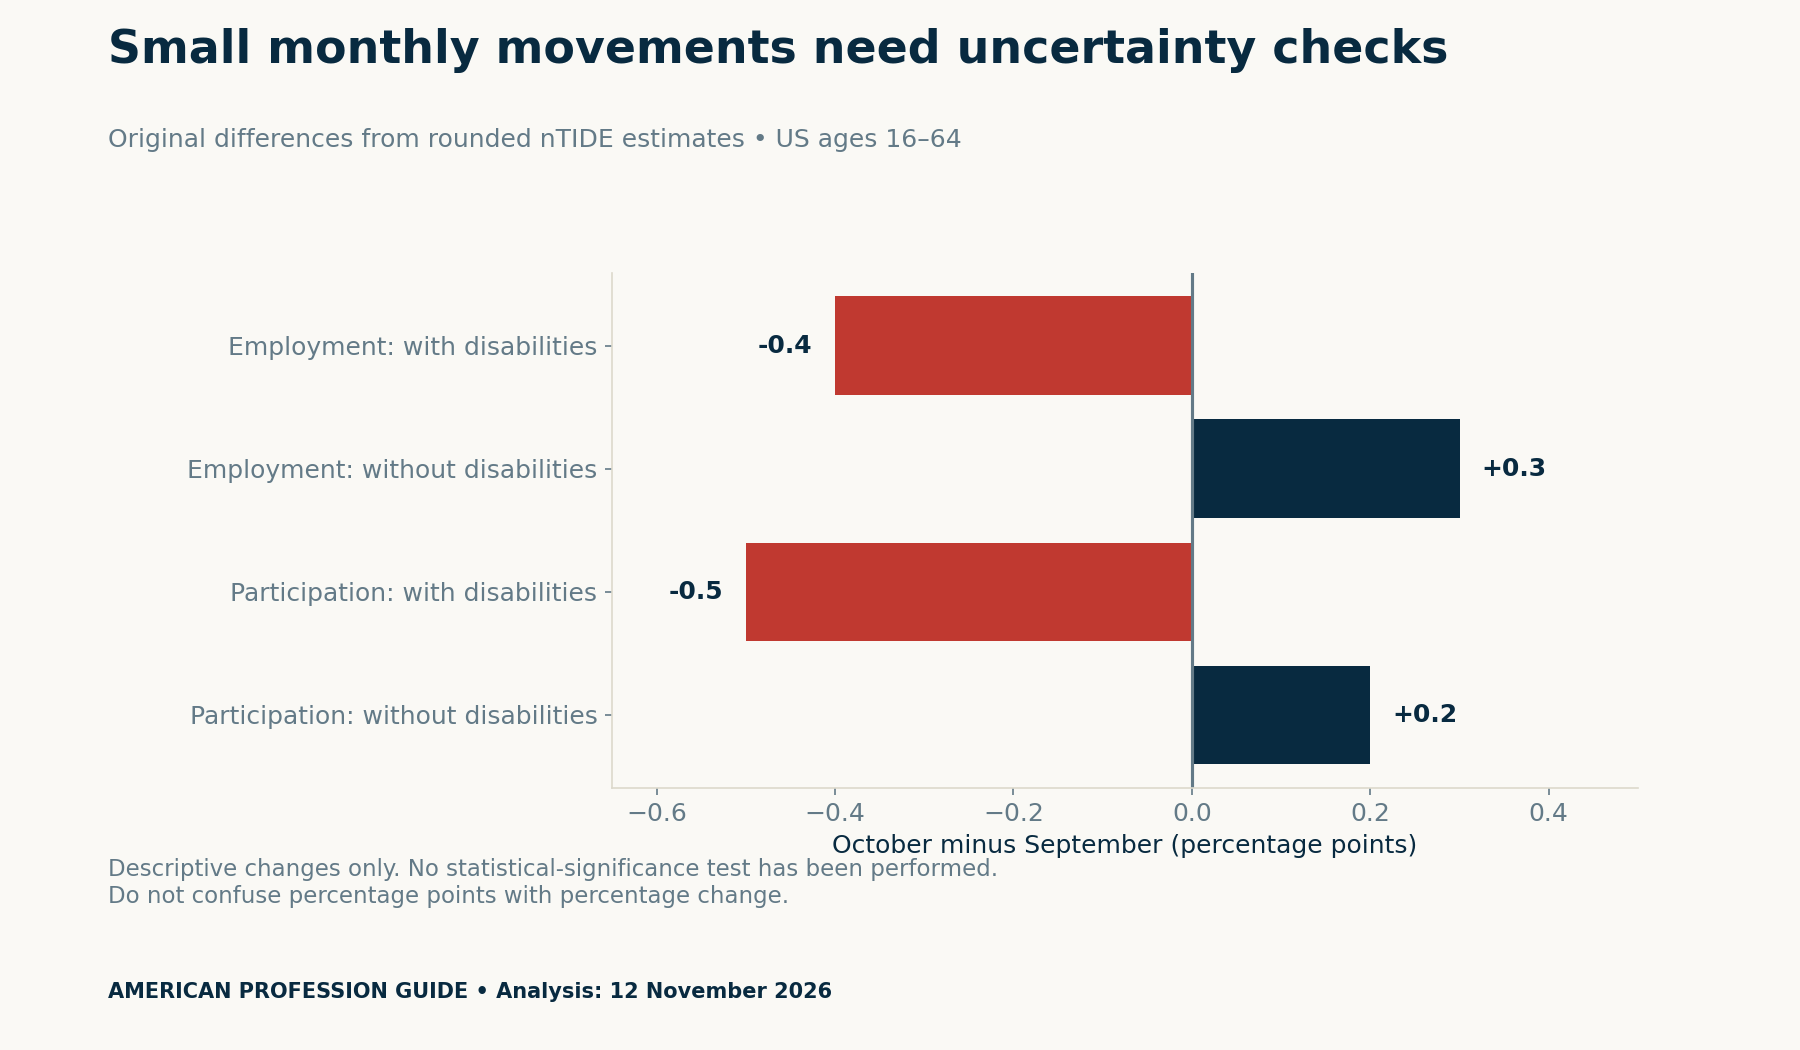
The four changes shown above come from subtracting September’s rounded estimates from October’s. Percentage points describe the difference between two percentages. They are distinct from percentage change, which divides that difference by the starting value. We retain the source’s precision rather than implying more accuracy through extra decimal places.
These comparisons do not identify why a person entered or left work. They also cannot separate an employer’s practices from local conditions, job mix or other influences. A credible causal claim would need an appropriate research design and uncertainty analysis.
Why the annual comparison is missing
The release provides no October year-over-year comparison because the federal shutdown halted CPS collection in October 2025. Our files mark that observation as unavailable. We neither invent a value nor substitute September to create an apparently complete annual series.
This is a useful reporting discipline beyond this release. Keep an explicit missing-data note when a comparison cannot be made. An absent observation is not zero employment, a stable rate or proof that nothing changed.
Build a service-outcome pathway with clear boundaries
National survey estimates describe a population. A local service register answers a different question: what happened to an agreed group during an agreed period? The following editorial framework helps organize that smaller question. It is a proposed design, not a validated provider scorecard.
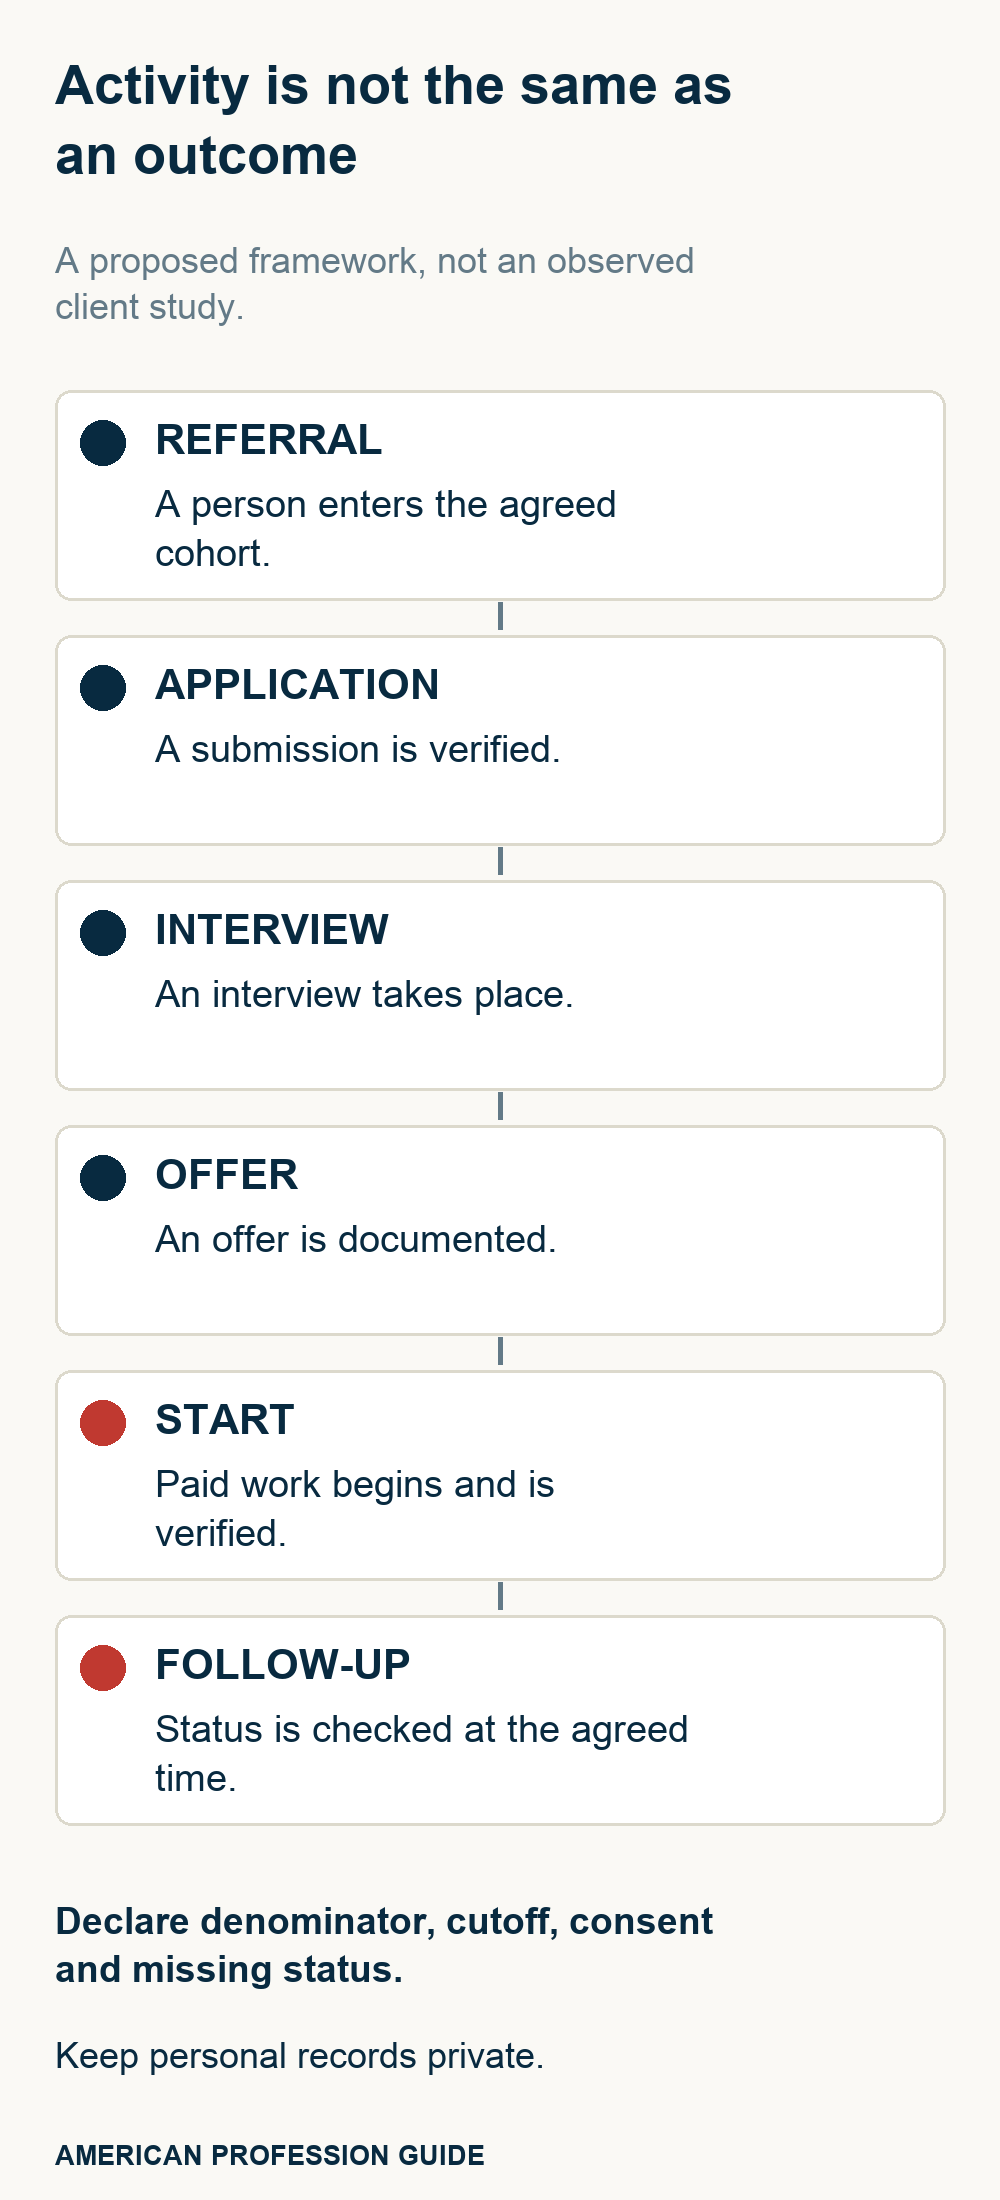
A referral is an entry point, not a job start. Likewise, a submitted application is not an interview, and an offer is not evidence that paid work began. Ask what evidence confirms each stage, who can access it and when the status was checked.
Before collecting records, agree definitions with participants and the responsible service team. Choose a cohort intake window, then define the deadlines for applications, starts and follow-up. Record voluntary withdrawal separately. A person’s choice to leave should not silently become either a success or a failure.
Keep missing follow-up visible
Suppose a service reports follow-up only for people it reached. Readers also need to know how many starts were due for follow-up and how many were not reached. Otherwise, a completed-only percentage can conceal uncertainty about the rest of the cohort.
Do not publish personal histories to prove a placement. Use anonymous case identifiers in approved private systems, restrict access and collect only information needed for the agreed purpose. The downloadable register deliberately omits names, diagnoses and contact details. It is a planning aid, not a recommendation to place confidential records in a public spreadsheet.
Use the framework for questions, not rankings
A provider serving people with different needs, locations or referral rules may have a different outcome mix. A simple placement percentage cannot establish which provider caused better results. Explain those differences before comparing totals, and avoid ranking people by disability status.
For an individual job search, focus on verified requirements, accessible application routes and the support the person wants. Our seasonal hiring analysis shows how to distinguish announcements from actual local requisitions. The performance-review evidence guide similarly emphasizes accepted work and clear definitions over activity counts.
Methods, downloads and reuse
We transcribed the November 6 release’s two monthly employment and participation estimates. Original calculations subtract rounded percentages, retaining one decimal place. No microdata analysis, significance test, benefits assessment or service evaluation was conducted. The national gap cannot establish discrimination’s share, another single cause or individual hiring odds.
- Source data: monthly employment and participation ratios (CSV).
- Reproducible percentage-point calculations and missing-data note (CSV).
- Blank anonymous service-outcome register (CSV).
- Suggested stage definitions and denominator rules (CSV).
The disability employment rate 2026 figures are national survey estimates, while the service templates are an original editorial proposal. Preserve that distinction when reusing either. Suggested citation: American Profession Guide, “Disability Employment Rate 2026: Progress and the Gap,” analysis dated November 12, 2026, using the November 6 nTIDE release.


