






Productivity evidence for performance review should explain what useful work changed, how quality held up and how much time it required. A national productivity headline can teach you to read a rate. It cannot score your individual contribution.
The November 5 BLS release offers a timely example. Preliminary nonfarm business productivity rose at a 3.6% annualized rate in the third quarter of 2026. However, that does not mean the actual one-quarter gain was 3.6%.
Evidence checked November 12, 2026. National figures below come from the preliminary BLS release. Workplace examples are fictional, and the blank log is a proposed self-review tool.
Read the national productivity figures correctly
The archived BLS release and Table A1 report quarterly annualized changes of 3.6% for productivity, 3.7% for output and 0.1% for hours. Hourly compensation rose 2.9%, while unit labor costs fell 0.7%. These figures describe the nonfarm business sector, with seasonal adjustment.
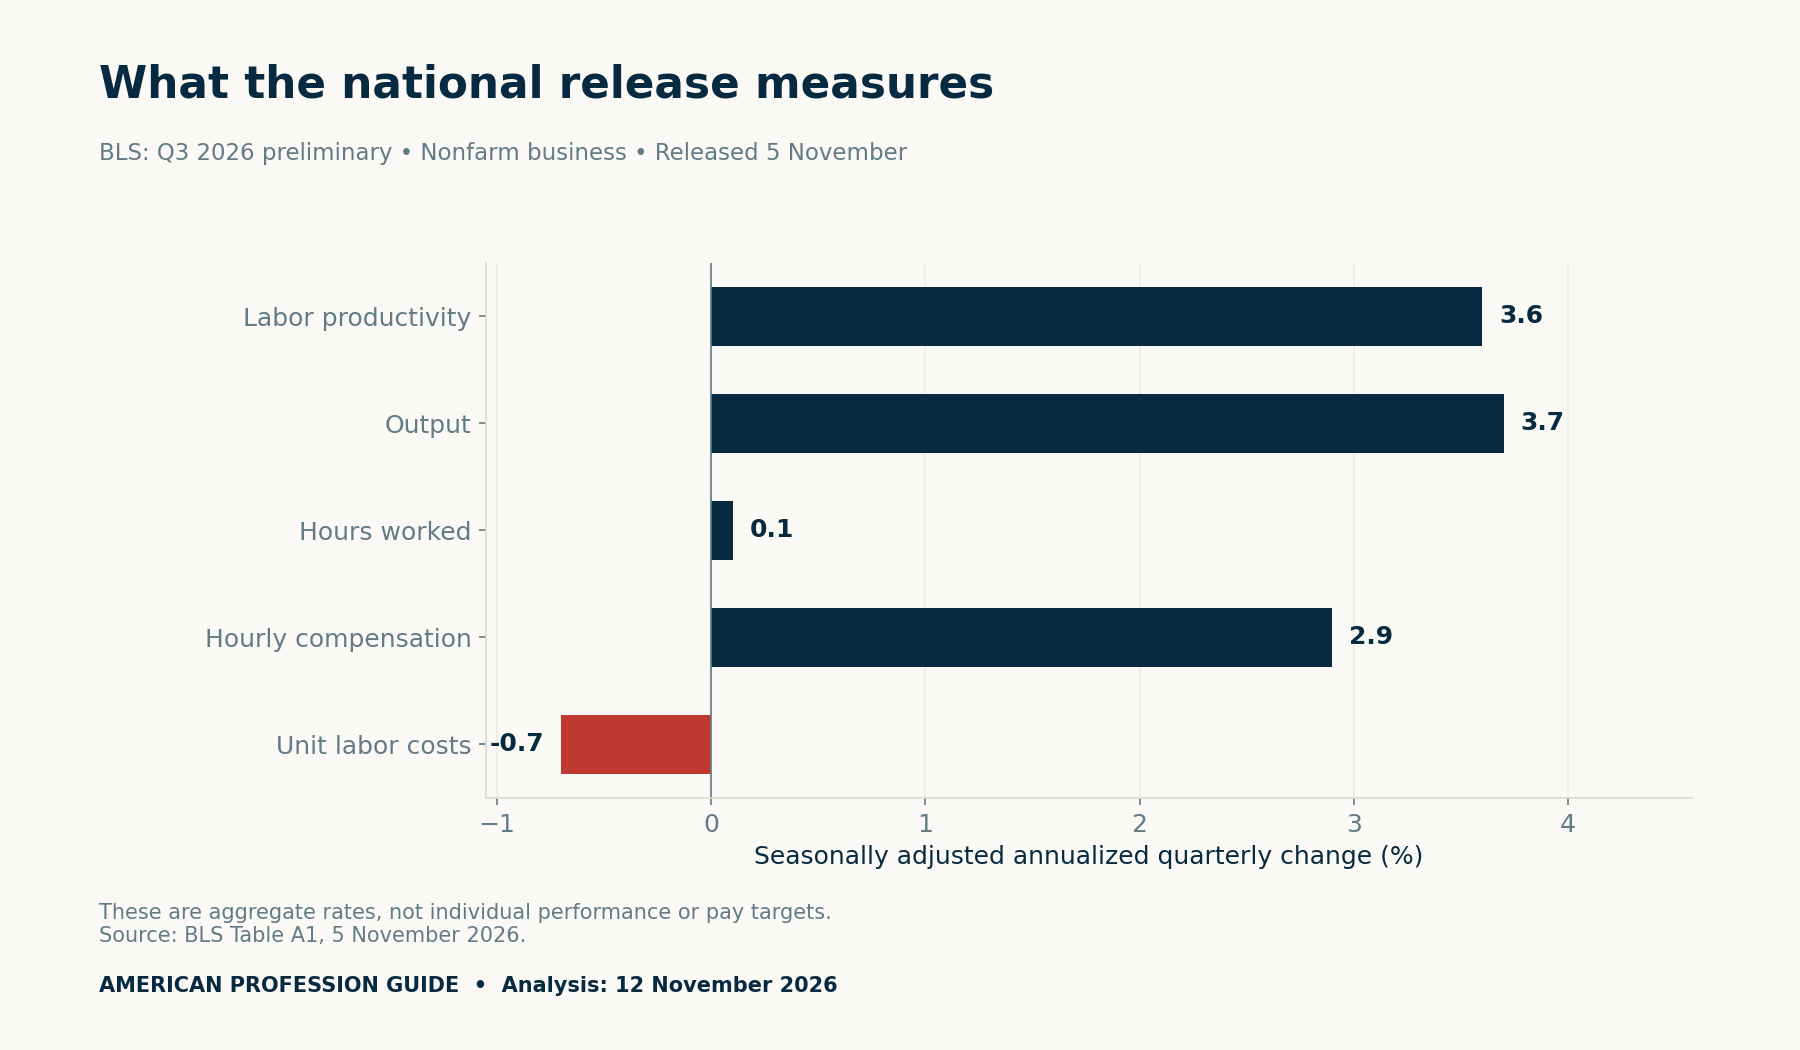
Keep the release date beside the measurement period. November is when BLS published these estimates; July through September is the quarter they describe. The preliminary status also matters because later releases can revise the values.
For a performance conversation, this is useful context about measurement. It is not evidence that your employer gained exactly the same amount or that you personally produced more.
Annualized growth is different from one-quarter growth
To express the published productivity rate as a one-quarter equivalent, use ((1 + 0.036)1/4 − 1) × 100. The result is approximately 0.89%. We calculate this from the rounded rate, so the result is also approximate.
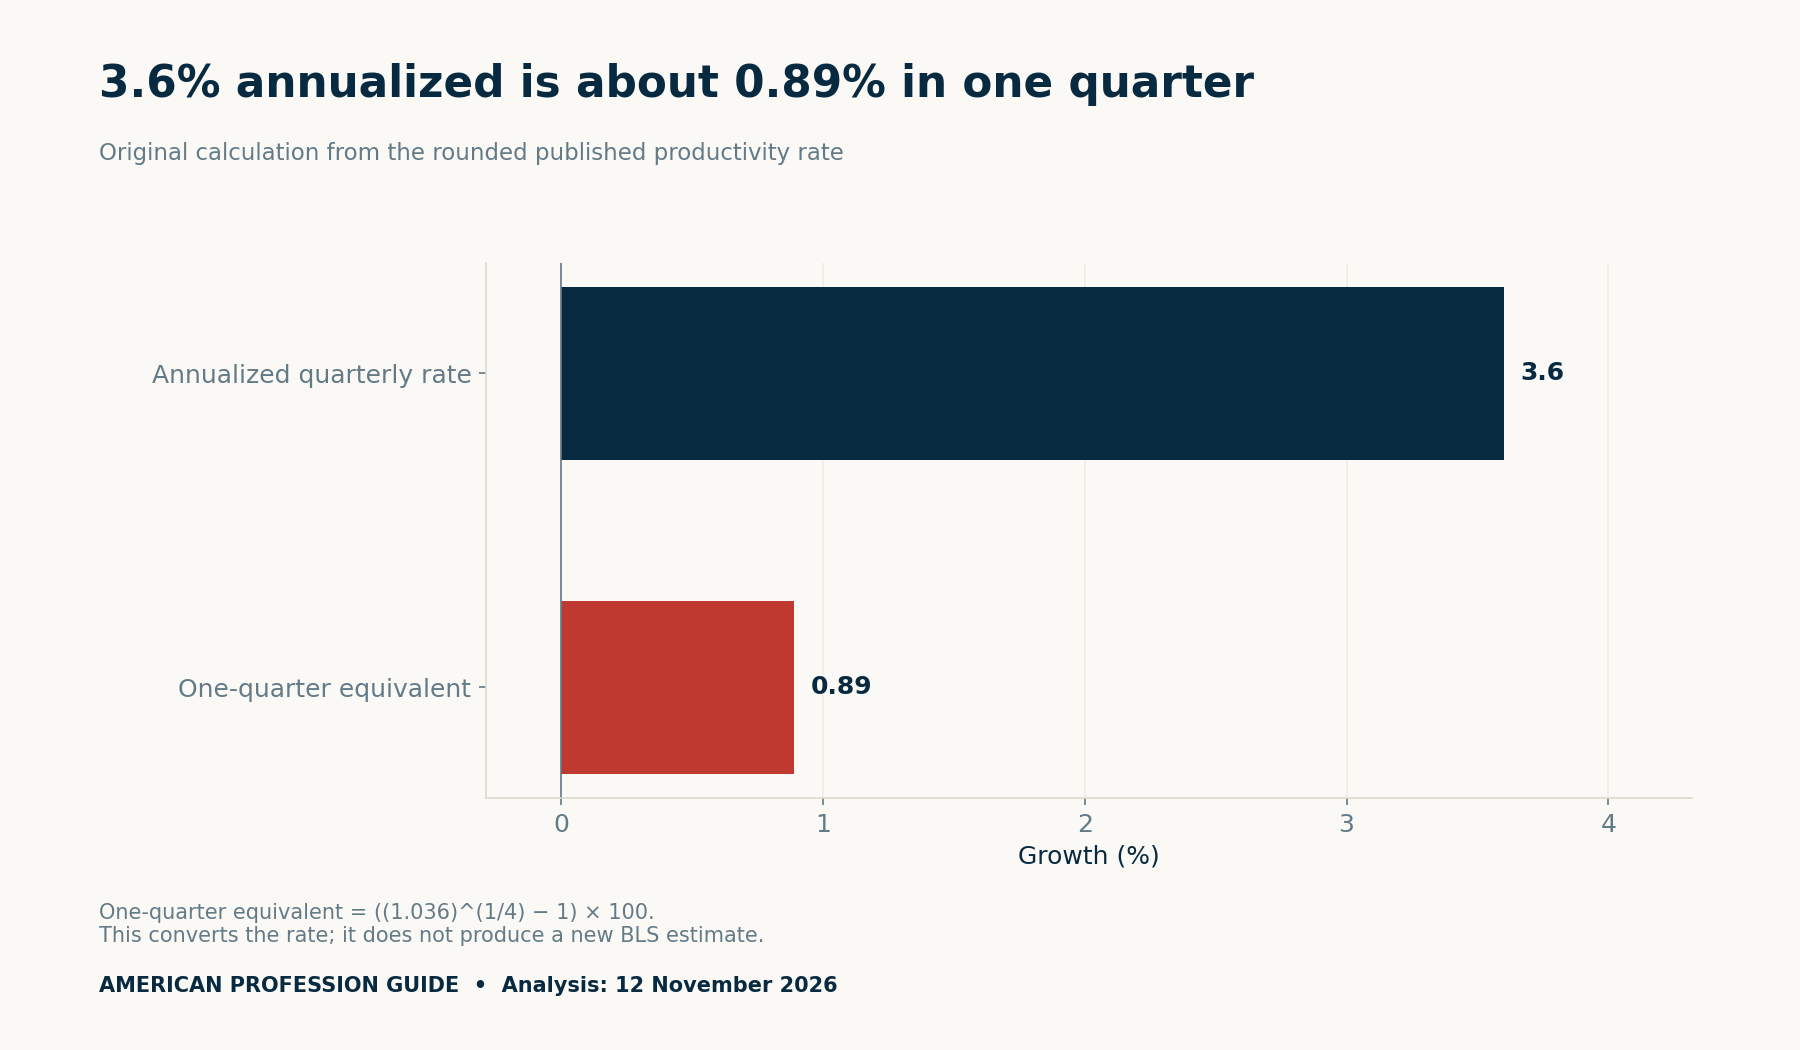
This conversion changes how the rate is expressed. It does not create a separate observation or predict that the same pace will continue. In particular, do not compare 3.6% annualized with a worker’s unannualized monthly gain as though they share a time basis.
The year-over-year figure asks another question. BLS reports productivity 2.1% above the same quarter in 2025. The next chart keeps that comparison separate.
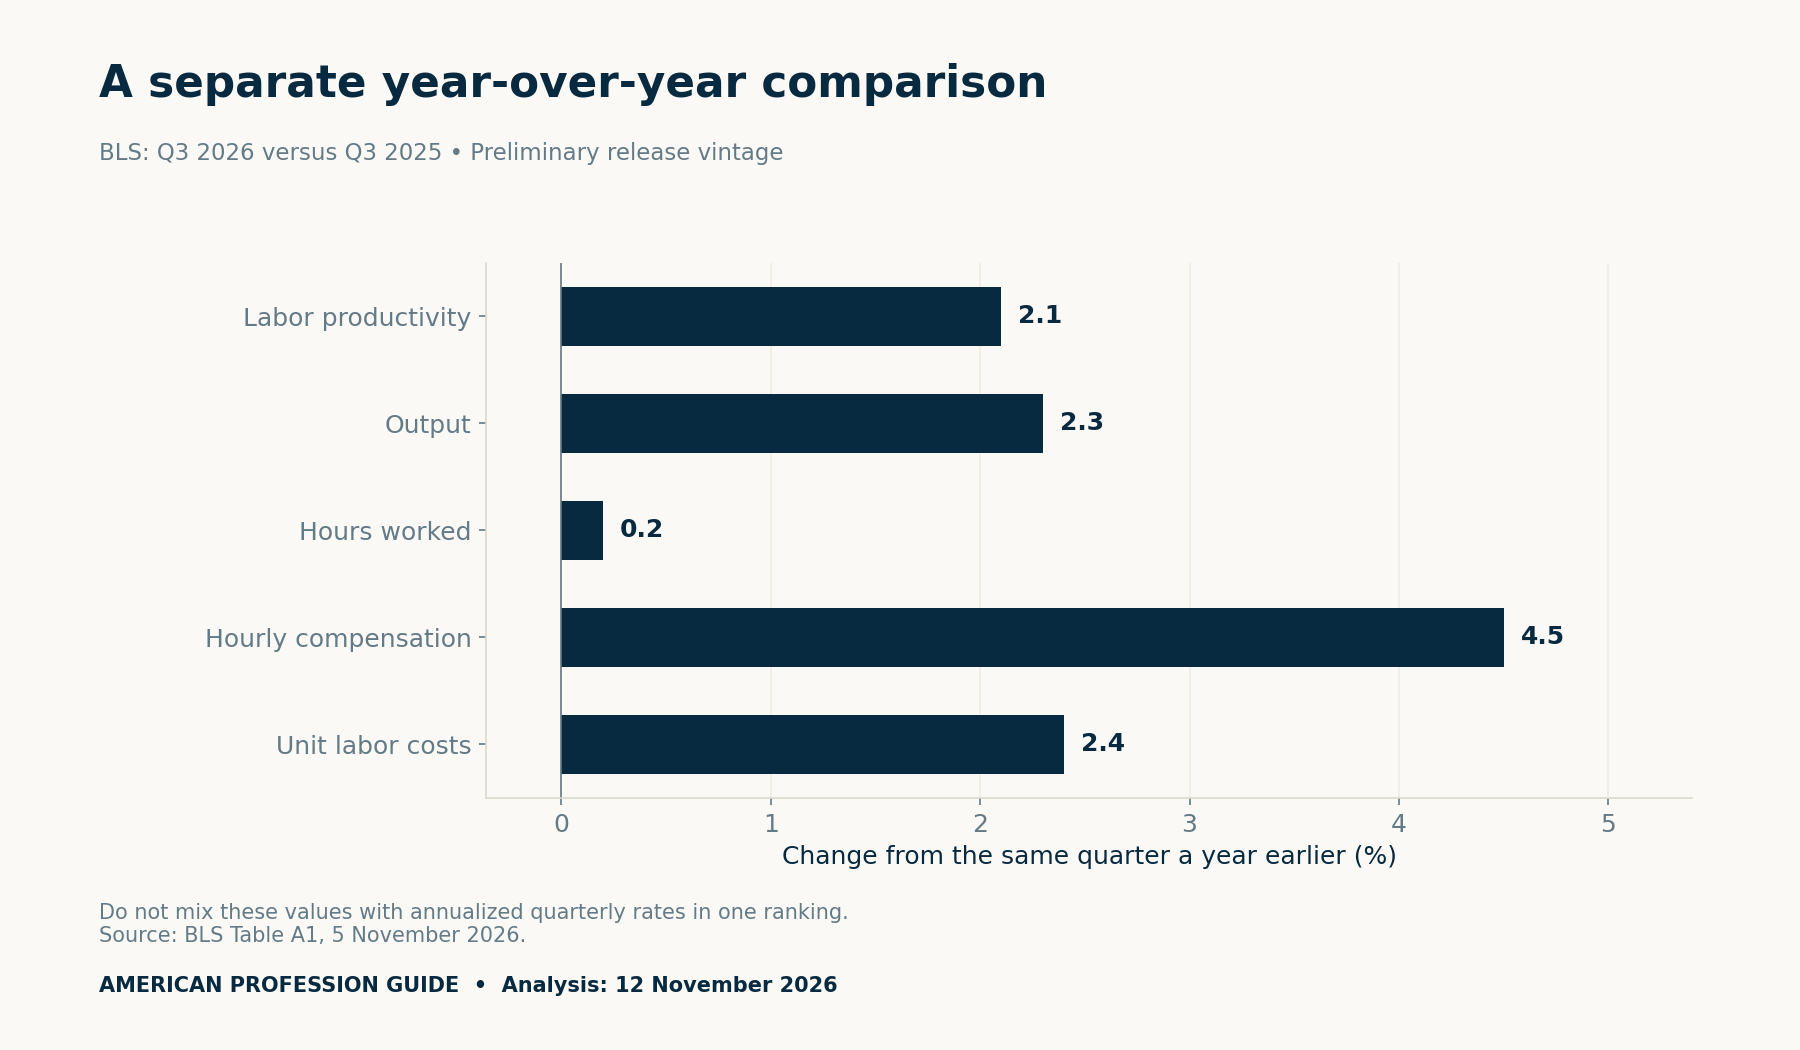
Notice how units and dates change the meaning of otherwise similar percentages. Apply the same discipline to your review notes: state the work period, baseline and denominator before describing an improvement.
Build productivity evidence for performance review
Start with a task family that you and your manager understand. Then agree what counts as accepted work. A completed draft, a submitted case and an accepted result may be three different stages.
The following evidence triangle is our editorial framework. It is not a BLS recommendation or a completed workplace experiment.
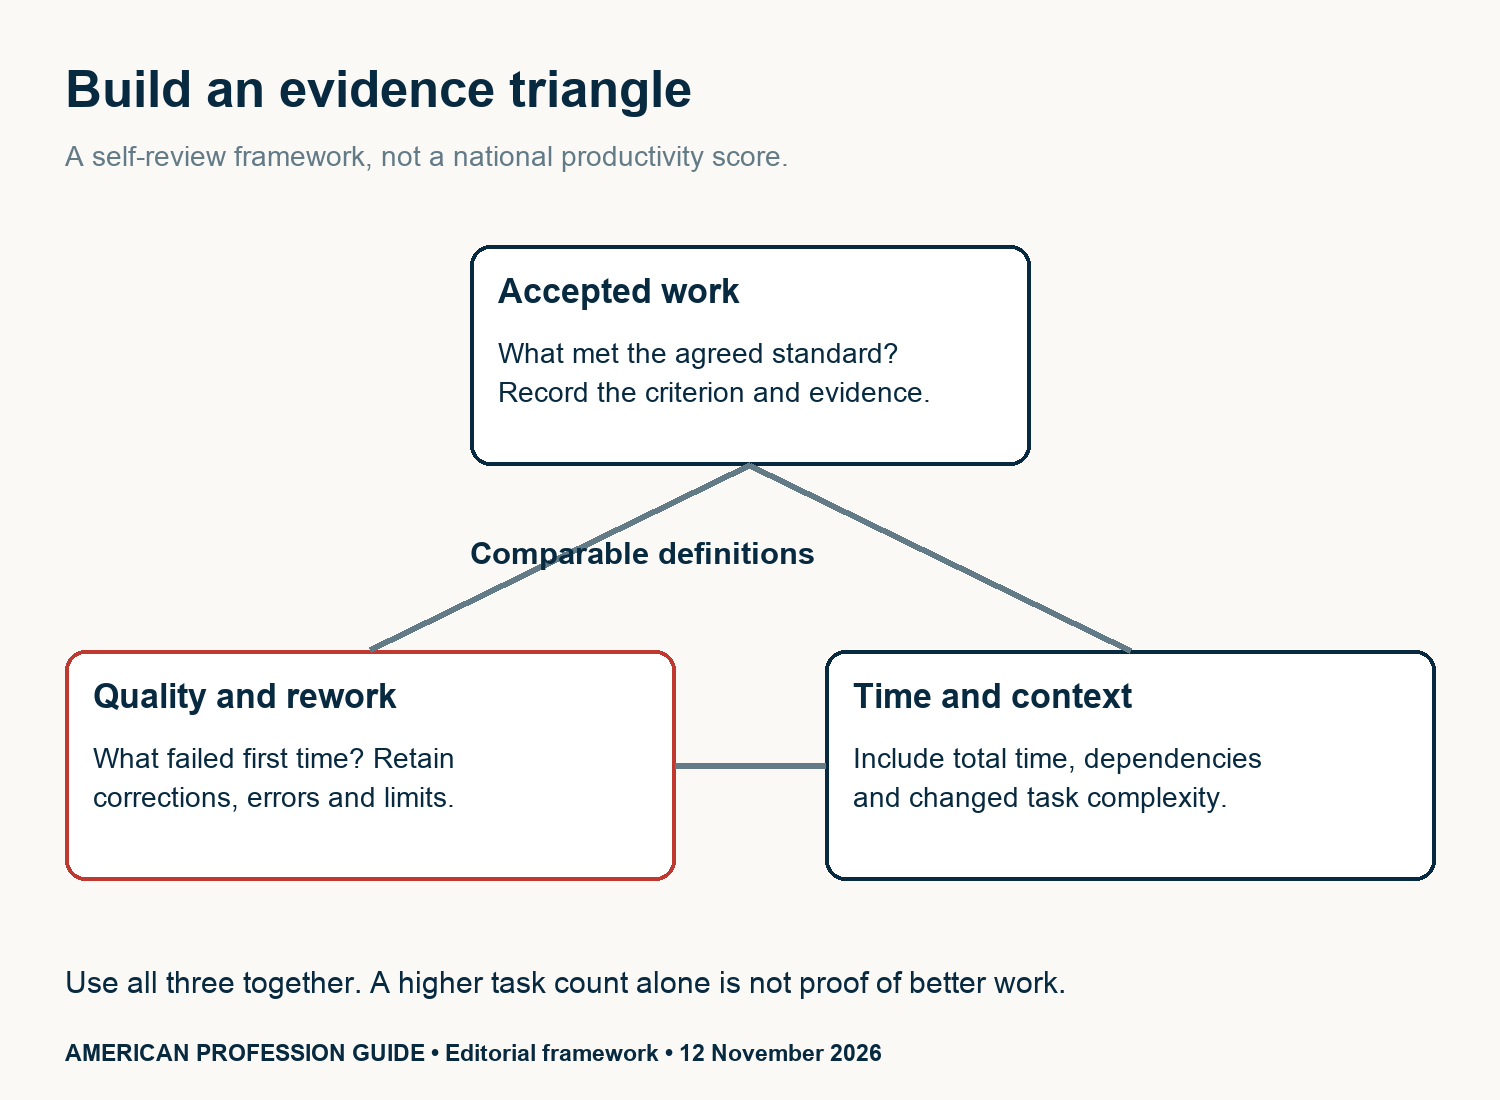
Each side answers a practical question:
- Accepted work: What met the agreed standard, and where is the supporting reference?
- Quality and rework: What needed correction, and did the first-pass result improve?
- Time and context: How much total work time was used, and what changed in complexity or support?
Use all three together. For example, a larger number of submitted items may hide more rejected work. Alternatively, fewer completed items may reflect a shift to harder cases. Explain those changes instead of forcing unlike work into one score.
A fictional accepted-output example
Suppose an invented baseline has 40 accepted units in 20 total work hours. That gives 2 accepted units per hour. A later fictional period has 45 accepted units in the same 20 hours, giving 2.25.
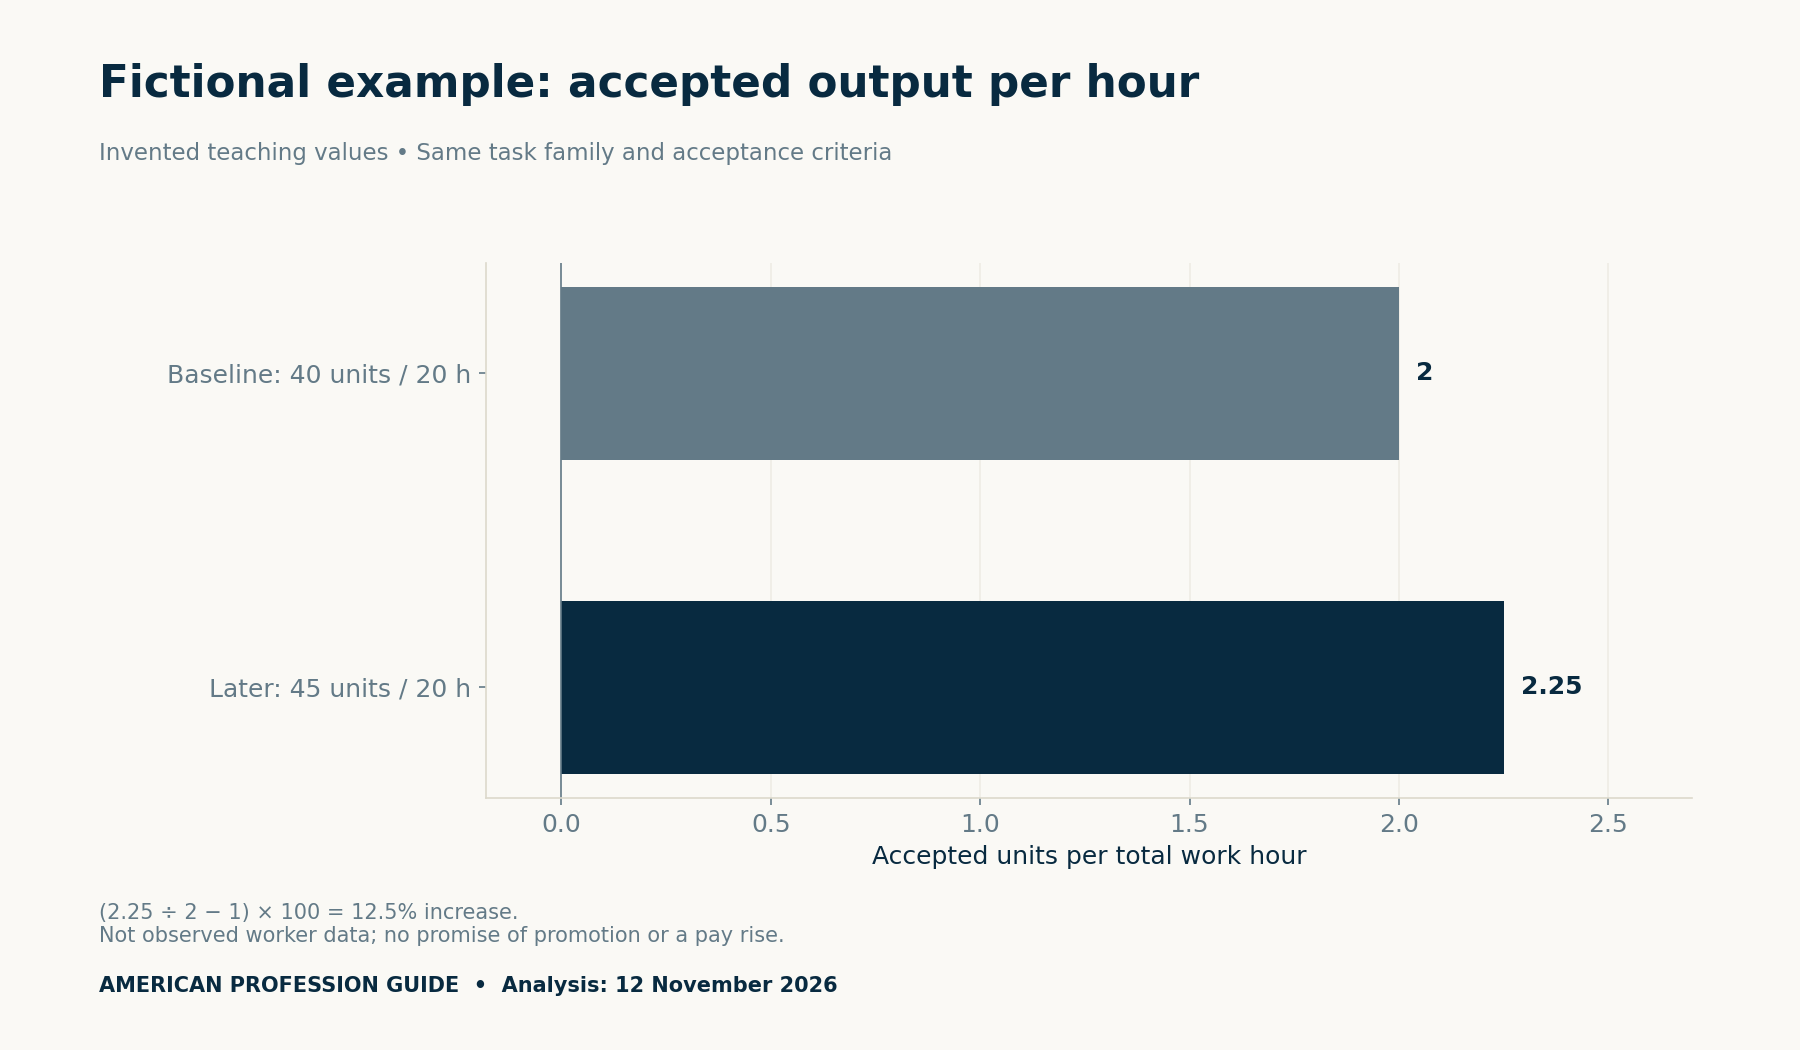
The rate change is (2.25 ÷ 2 − 1) × 100 = 12.5%. All these workplace inputs are invented to explain arithmetic. They are not an observed employee improvement, an industry benchmark or a promised result.
This comparison is useful only under its stated assumptions. Keep task complexity, acceptance criteria and the time definition comparable. Also explain shared contributions: a new tool, clearer instructions or help from a colleague may have changed the result.
Include rework in productivity evidence for performance review
A rate can look stronger simply because its denominator leaves work out. In a second fictional sensitivity check, retain 45 accepted units but allow 25 total hours instead of 20. The rate becomes 1.8 accepted units per hour.
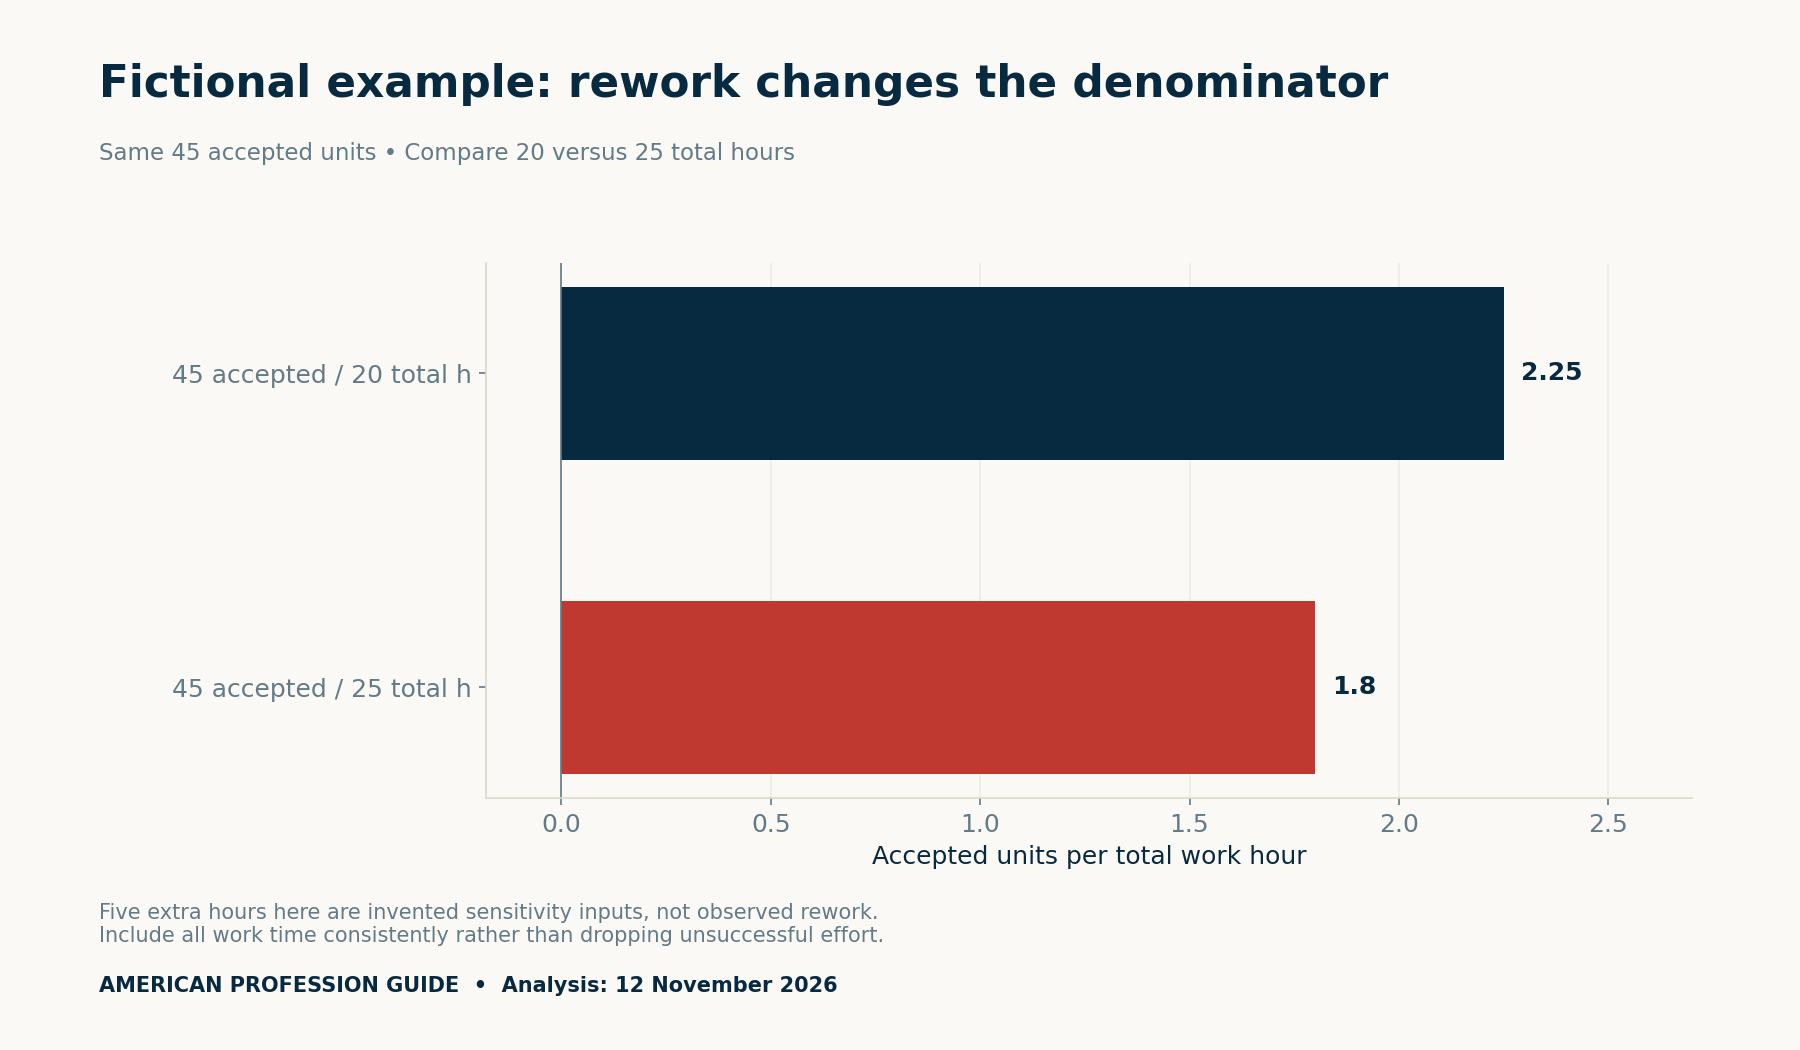
The extra five hours are invented sensitivity inputs. They illustrate why total time needs a consistent definition. Do not record only successful production time while excluding correction, preparation or other time required by that same task family.
Likewise, record a first-pass quality measure with its own denominator. State how many units were submitted and how many met the standard immediately. An acceptance rate and output per hour measure different things.
Use a bounded four-week self-review
Our proposed exercise uses one agreed task family for four weeks. No employee trial has been run. Adapt it with your manager before collecting information, especially where safety or care quality takes priority over throughput.
- Write the task definition and acceptance criterion before the first week.
- Record completed and accepted units, including failures and rework.
- Use the same total-time rule throughout the period.
- Flag changes in complexity, dependencies or available tools.
- Prepare a brief explanation of the evidence and its limits.
Keep confidential examples in approved internal systems. The public template needs an internal evidence reference, not a copied client record or private employee history. Do not use this log to monitor colleagues or rank people doing different work.
Present a contribution, not a pay formula
A concise review note can follow this structure: “For this task family and period, these results met the agreed standard. This quality measure changed, and total time used this definition. These dependencies and limitations affect the comparison.”
Then discuss the next objective with your manager. The national release does not prove AI caused your result, establish your effort or determine a deserved percentage raise. The log also cannot isolate every influence on workplace output.
If compensation enters the conversation, our total compensation statement guide helps separate cash, benefits and other components. Keep that assessment distinct from a simple output-rate calculation.
Download the productivity evidence tools
The four CSV files preserve the boundary between official data, original calculations and a future self-review. The contribution log is blank; it contains no employee records.
- BLS source data and rate definitions (CSV)
- Calculations and fictional examples (CSV)
- Blank contribution log (CSV)
- Measure dictionary (CSV)
Methods and limitations
We transcribed the two nonfarm business rows from BLS Table A1 and retained the November 5 preliminary vintage. The charts separate annualized quarterly rates from year-over-year changes. The conversion uses the published rounded 3.6% rate.
The fictional arithmetic is independently reproducible from the accompanying calculation file. Its 40, 45, 20 and 25 inputs are teaching assumptions, not research findings. No performance-review outcome or pay improvement has been tested.
BLS aggregate productivity reflects more than individual effort, including capital, technology, organization and workforce composition. Our practical framework helps describe evidence; it does not establish causality or a fair ranking across different jobs. Reuse the charts with their period, vintage and fictional-example labels intact.


