







Work from home by state looks very different depending on whether you measure the share of workers or the number of people. Colorado leads the 50 states by share, at 19.9%. California has the largest number of usual home-based workers, at 2.67 million. At 22.9%, the District of Columbia has a still higher share. We identify it separately because it is not a state.
American Profession Guide analyzed U.S. Census Bureau data for all 50 states, D.C., and the nation. In 2024, 22,026,371 workers usually worked from home, or 13.3% of workers age 16 and older. Compared with 2021, the national share was lower. However, it remained more than twice the published 2019 share of 5.7%.
2026 research edition; 2024 data. As of our October 19, 2026 research date, 2024 is the latest available ACS one-year release. The Census release schedule lists October 29, 2026 for the 2025 estimates. This article does not describe a live count of remote jobs or claim to measure 2026 working arrangements.
Explore the key findings, highest shares, complete state table, and methodology. Both the source extract and our state comparisons are available as downloadable CSV files.
Five findings about work from home by state
- The national share remains well above its pre-pandemic level. It rose from 5.7% in 2019 to 13.3% in 2024, a gain of 7.6 percentage points. The estimated worker count rose by 13.06 million.
- Colorado leads the states; D.C. is higher still. Their 2024 shares are 19.9% and 22.9%, respectively. Oregon follows Colorado among the states, at 17.1%.
- Mississippi has the lowest state point estimate, at 6.2%. Even that is above its 2019 estimate of 3.1%. Every state and D.C. has a higher published share than in 2019.
- Five states account for 37.9% of all U.S. home-based workers. California, Texas, Florida, New York, and Pennsylvania together account for 8,358,350 people.
- Recent declines are not equally certain everywhere. Forty-three states or D.C. have lower point estimates in 2024 than in 2023. Twenty of those declines pass our approximate, individual 90% significance screen.
These findings use the “worked from home” category in ACS table DP03. The figures describe where workers live. They do not count remote job advertisements, employer headquarters, or all people who work at home occasionally. That distinction is central to interpreting the rankings.
What “worked from home” means in the Census data
The Census Bureau’s definition comes from a question about the usual way workers got to work during the previous week. It applies to people age 16 and older who were employed and at work. Workers who reported working from home form the category used here.
Therefore, this is a measure of usual home-based work, rather than every instance of remote work. A person who spends most workdays at an office and occasionally works at home may fall outside it. Conversely, a self-employed person who usually works at home can be included. The measure is broader than employees using video calls.
| Measure in this report | What it tells you | What it does not measure |
|---|---|---|
| Home-based worker share | Percentage of resident workers age 16+ who usually worked from home | Percentage of jobs advertised as remote |
| Home-based worker count | Estimated people in that category | Employers offering flexible work |
| Change in share | Difference between two annual percentage estimates | The same individuals changing their work arrangements |
| Margin of error | Published sampling uncertainty at the 90% confidence level | Every possible source of survey error |
The denominator also matters. The 2024 national percentage uses 165,360,450 workers, not the entire U.S. population or the full labor force. People who are unemployed are not part of this commuting measure. Likewise, the survey does not limit this table to full-time salaried employees.
The national trend: lower than 2021, higher than 2019
The national home-based work share was 17.9% in 2021. It then stood at 15.2% in 2022, 13.8% in 2023, and 13.3% in 2024. Thus, the latest estimate is 4.6 percentage points below 2021 and 7.6 points above 2019. Both comparisons matter when describing the direction of change.
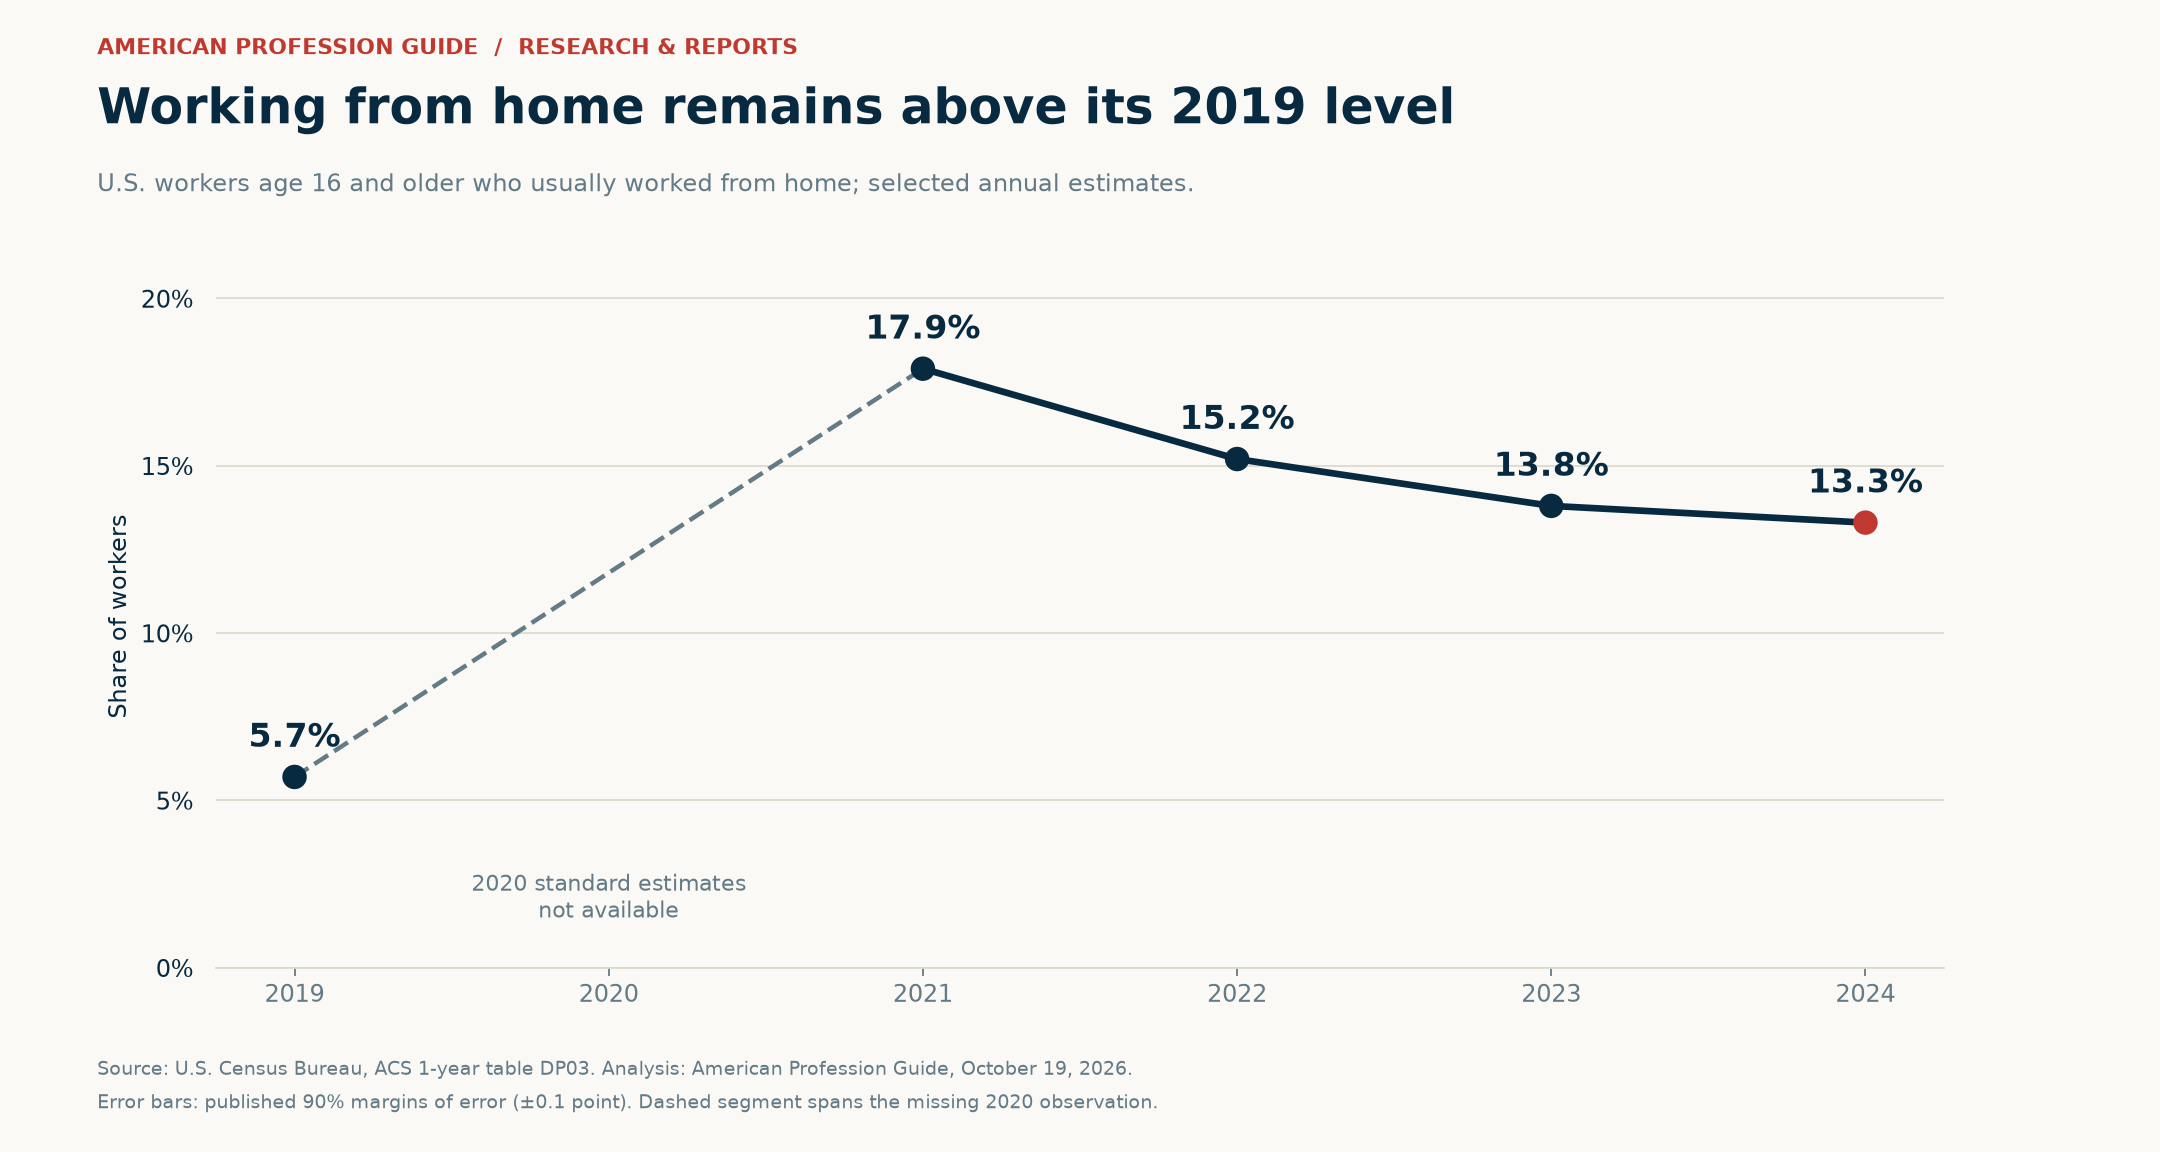
| Year | Usually worked from home | Share of workers | 90% share MOE |
|---|---|---|---|
| 2019 | 8,970,800 | 5.7% | ±0.1 point |
| 2021 | 27,568,098 | 17.9% | ±0.1 point |
| 2022 | 24,381,732 | 15.2% | ±0.1 point |
| 2023 | 22,486,510 | 13.8% | ±0.1 point |
| 2024 | 22,026,371 | 13.3% | ±0.1 point |
The estimated count increased from 8,970,800 in 2019 to 22,026,371 in 2024. That is about 2.46 times the earlier count. However, the share increased by a different multiple because the total number of workers also changed. Counts and percentages should not be substituted for one another.
Why the chart skips 2020
The Census Bureau did not release standard ACS one-year estimates for 2020 because of pandemic-related data quality problems. Its experimental estimates should not be compared with the standard series. We leave that year unfilled and show the gap explicitly, following the Census comparison guidance.
A falling annual share does not reveal which employers changed their policies or which workers returned to an office. This dataset combines many people and circumstances. It cannot isolate the effects of return-to-office mandates, hiring patterns, migration, or changes in the mix of occupations.
Where work from home is most common
D.C. has the highest point estimate in the 51-area comparison, at 22.9%. Among states, Colorado is first at 19.9%, followed by Oregon at 17.1%. Washington and Arizona have estimates of 16.4% and 16.3%. Their proximity is one reason to keep margins of error beside a ranking.
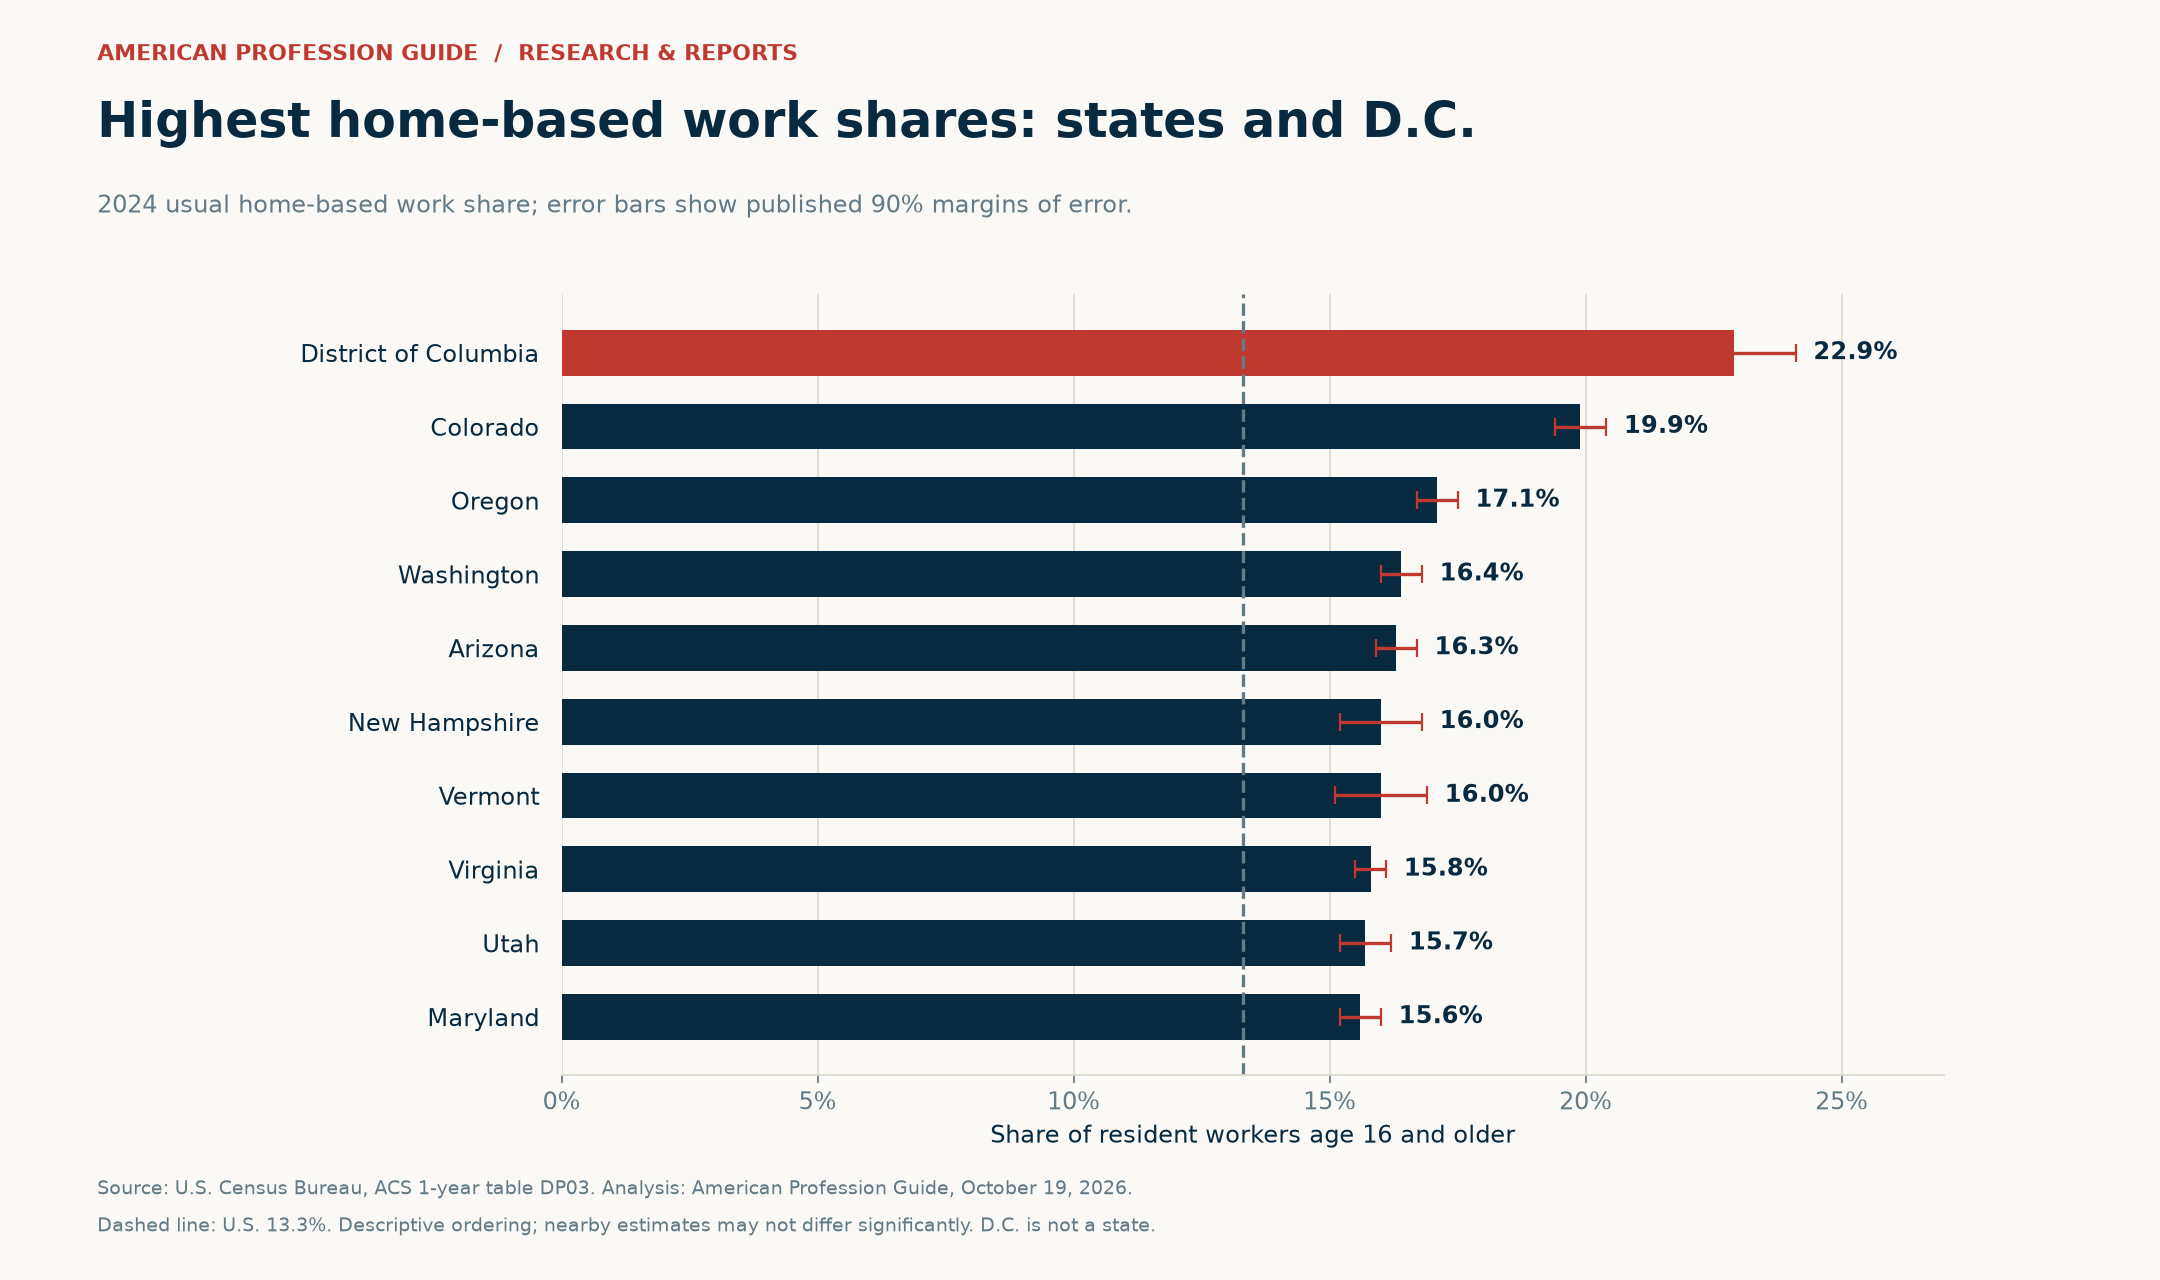
| State or D.C. | 2024 share ± MOE | Home-based workers | 2019 share | Change, points |
|---|---|---|---|---|
| District of Columbia | 22.9% ±1.2 | 88,726 | 7.4% | +15.5 |
| Colorado | 19.9% ±0.5 | 629,420 | 9.1% | +10.8 |
| Oregon | 17.1% ±0.4 | 354,930 | 7.3% | +9.8 |
| Washington | 16.4% ±0.4 | 645,514 | 6.5% | +9.9 |
| Arizona | 16.3% ±0.4 | 582,289 | 7.6% | +8.7 |
| New Hampshire | 16.0% ±0.8 | 120,950 | 7.3% | +8.7 |
| Vermont | 16.0% ±0.9 | 54,357 | 7.0% | +9.0 |
| Virginia | 15.8% ±0.3 | 703,153 | 5.8% | +10.0 |
| Utah | 15.7% ±0.5 | 277,963 | 7.4% | +8.3 |
| Maryland | 15.6% ±0.4 | 504,513 | 5.5% | +10.1 |
Read the leading shares with their uncertainty
Colorado’s estimate is 19.9% with a margin of error of 0.5 percentage point. That gives an approximate 90% interval from 19.4% to 20.4%. D.C.’s 22.9% estimate has a wider margin of 1.2 points, giving an interval from 21.7% to 24.1%.
New Hampshire and Vermont both show 16.0%, but their margins are 0.8 and 0.9 point. We keep that tie visible rather than manufacturing a distinction from extra decimal places. Across all 50 states and D.C., 21 point estimates exceed the national 13.3%. That count is descriptive, not a test against the national estimate.
Where usual home-based work is least common
Mississippi has a 6.2% estimate, followed by North Dakota at 7.1%. Louisiana and South Dakota each stand at 8.0%. The ten lowest state point estimates range from 6.2% to 8.9%. Nevertheless, all ten are higher than their own 2019 published shares.
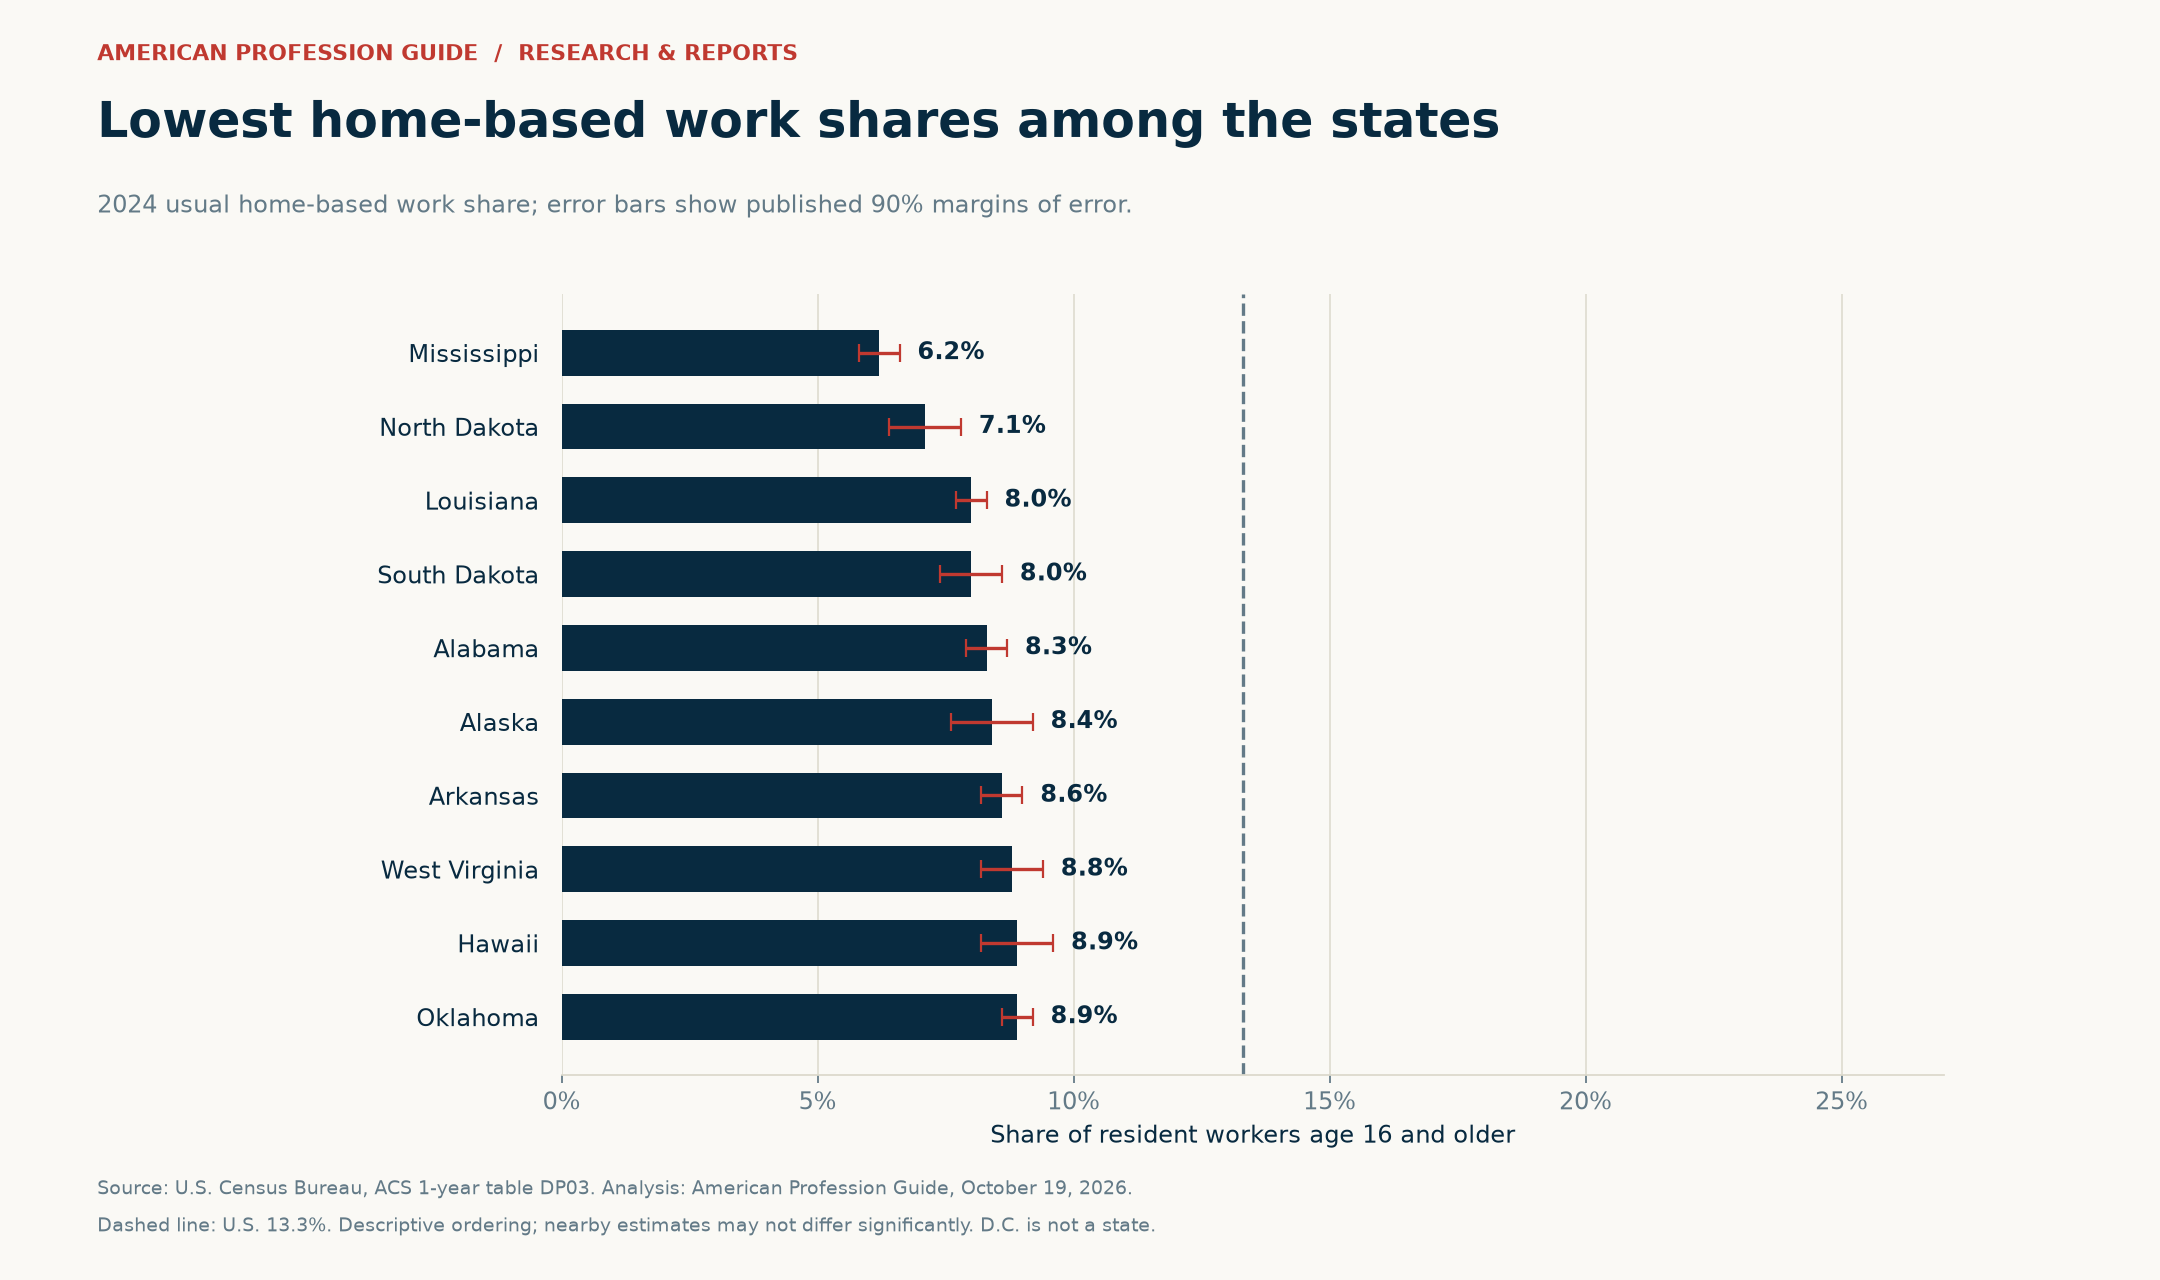
Colorado’s share exceeds Mississippi’s by 13.7 percentage points. Their published percentages differ by roughly a factor of 3.2. However, the table does not explain that difference. Occupation mix, industry, employer practices, and worker circumstances require separate evidence before making causal claims.
Nor does a low state share mean that every career there requires an on-site presence. State averages combine many communities and occupations. A software team, a hospital, and a construction site may have very different work-location requirements within the same state.
The largest home-based workforces are in large states
California has 2,672,106 usual home-based workers, followed by Texas with 1,956,349 and Florida with 1,721,372. New York and Pennsylvania complete the top five. Together, those five states account for 8.36 million people, or 37.9% of the national estimate.
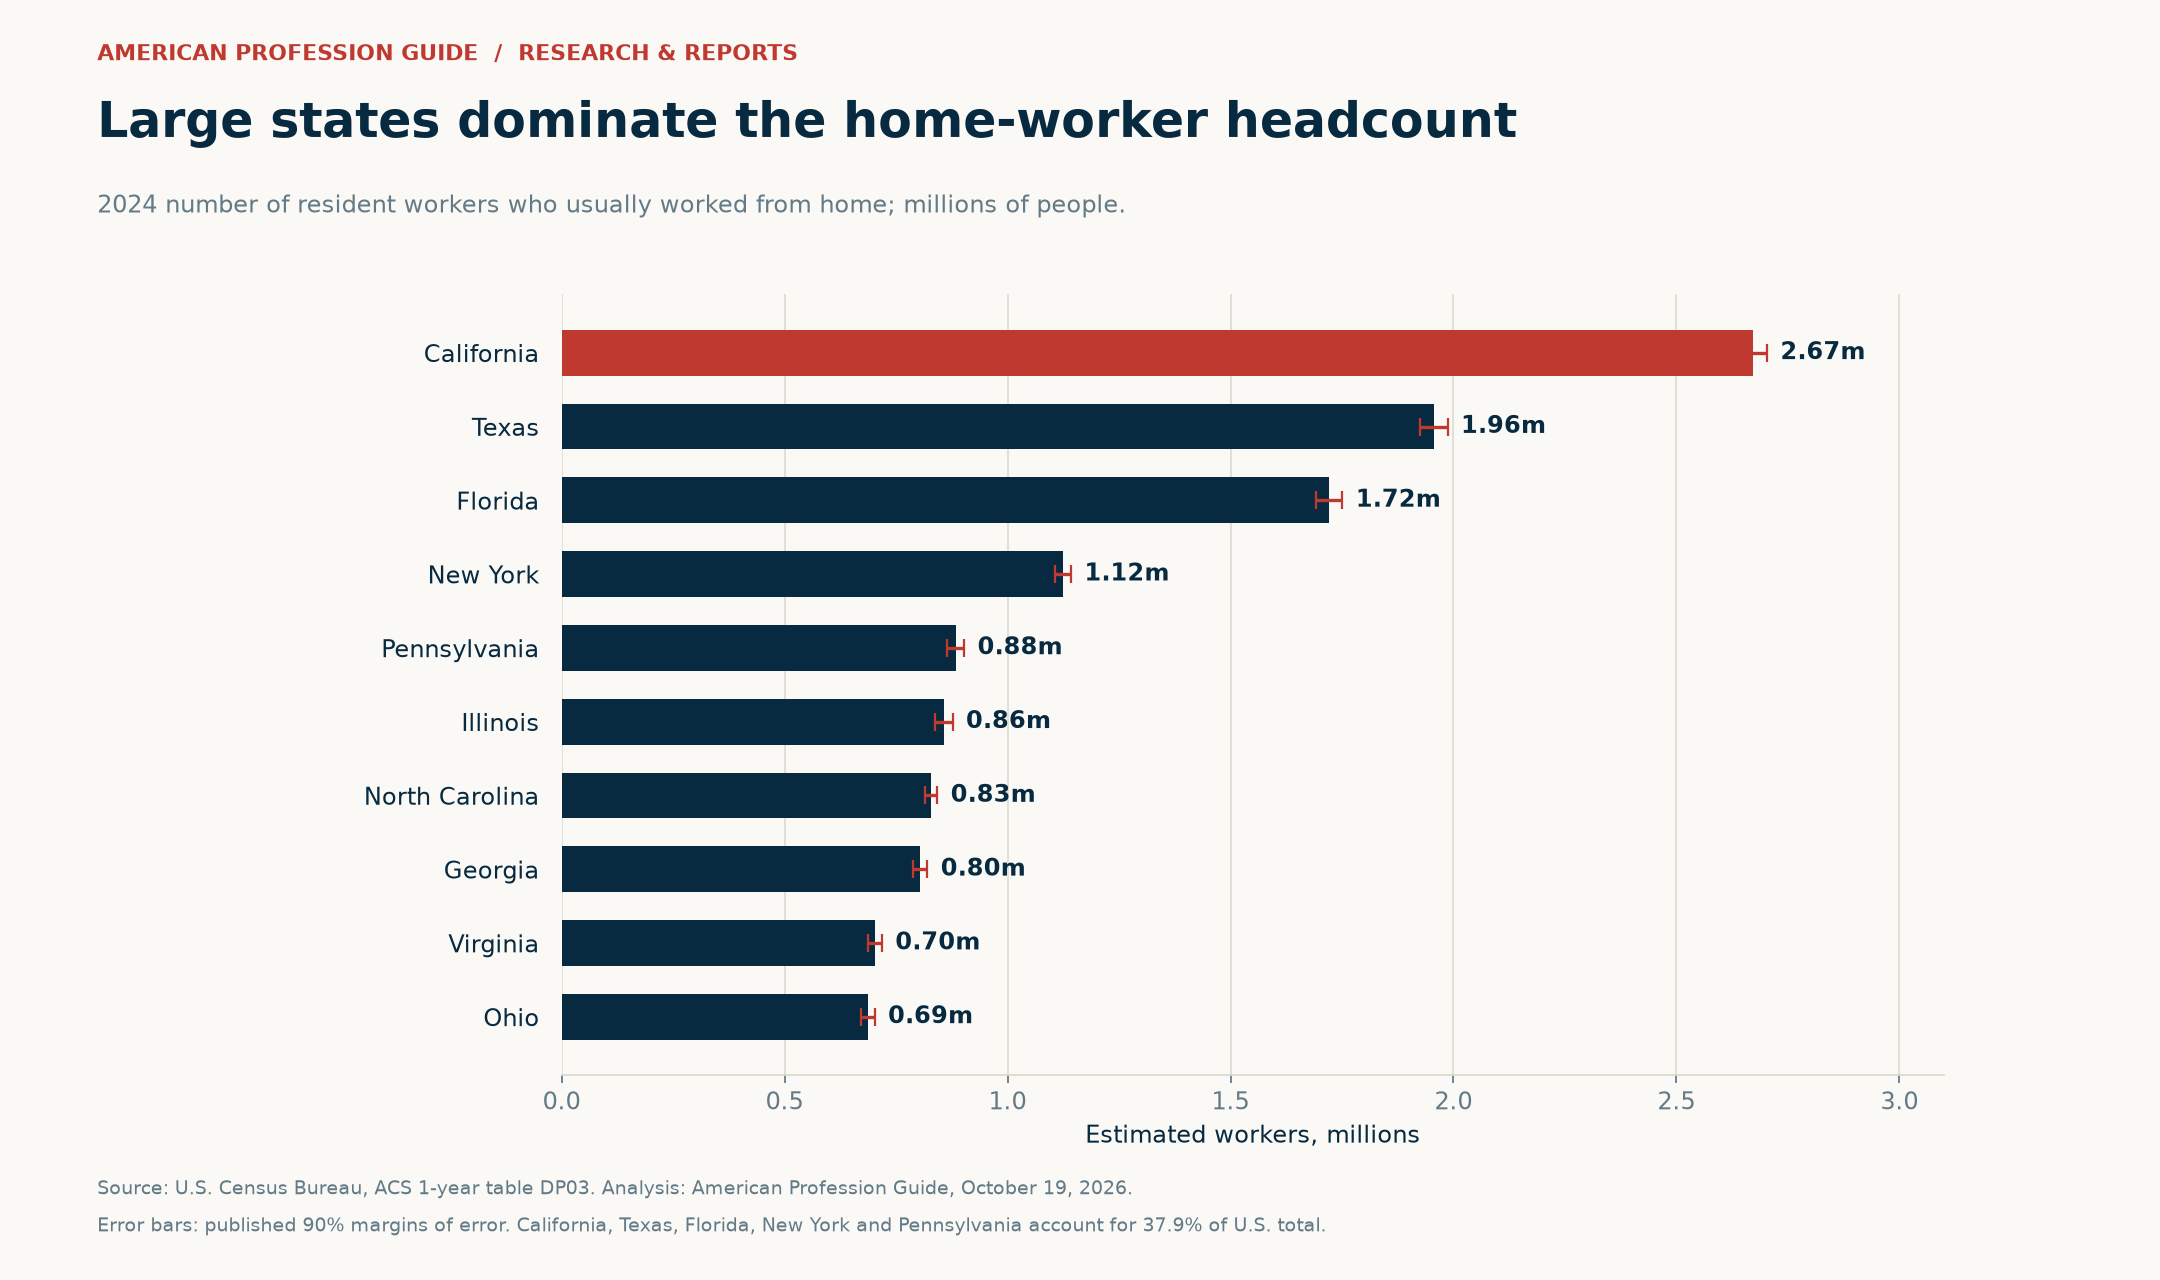
| State | Home-based workers | 2024 share | Share of U.S. home workers |
|---|---|---|---|
| California | 2,672,106 | 14.1% | 12.1% |
| Texas | 1,956,349 | 12.9% | 8.9% |
| Florida | 1,721,372 | 15.5% | 7.8% |
| New York | 1,124,869 | 11.8% | 5.1% |
| Pennsylvania | 883,654 | 13.8% | 4.0% |
| Illinois | 857,301 | 13.6% | 3.9% |
| North Carolina | 828,181 | 15.4% | 3.8% |
| Georgia | 803,593 | 14.9% | 3.6% |
| Virginia | 703,153 | 15.8% | 3.2% |
| Ohio | 687,025 | 11.9% | 3.1% |
Why the count ranking differs from the share ranking
Texas has a 12.9% home-based work share, slightly below the national point estimate, yet the second-largest count. Colorado has the highest state share but a smaller count of 629,420. A large workforce can produce a large number of home-based workers without an unusually high percentage.
D.C. illustrates the same distinction from the other direction. Its 22.9% share corresponds to 88,726 people. The high share describes the composition of its resident workforce. It does not mean D.C. has more remote workers than California or Texas, nor does it count everyone employed by organizations based there.
Where work from home increased most since 2019
D.C.’s published share rose by 15.5 percentage points between 2019 and 2024. Colorado’s rose by 10.8 points, Maryland’s by 10.1, and Virginia’s by 10.0. Washington and Oregon follow with gains of 9.9 and 9.8 points. These are changes in percentage points, not percentage growth rates.
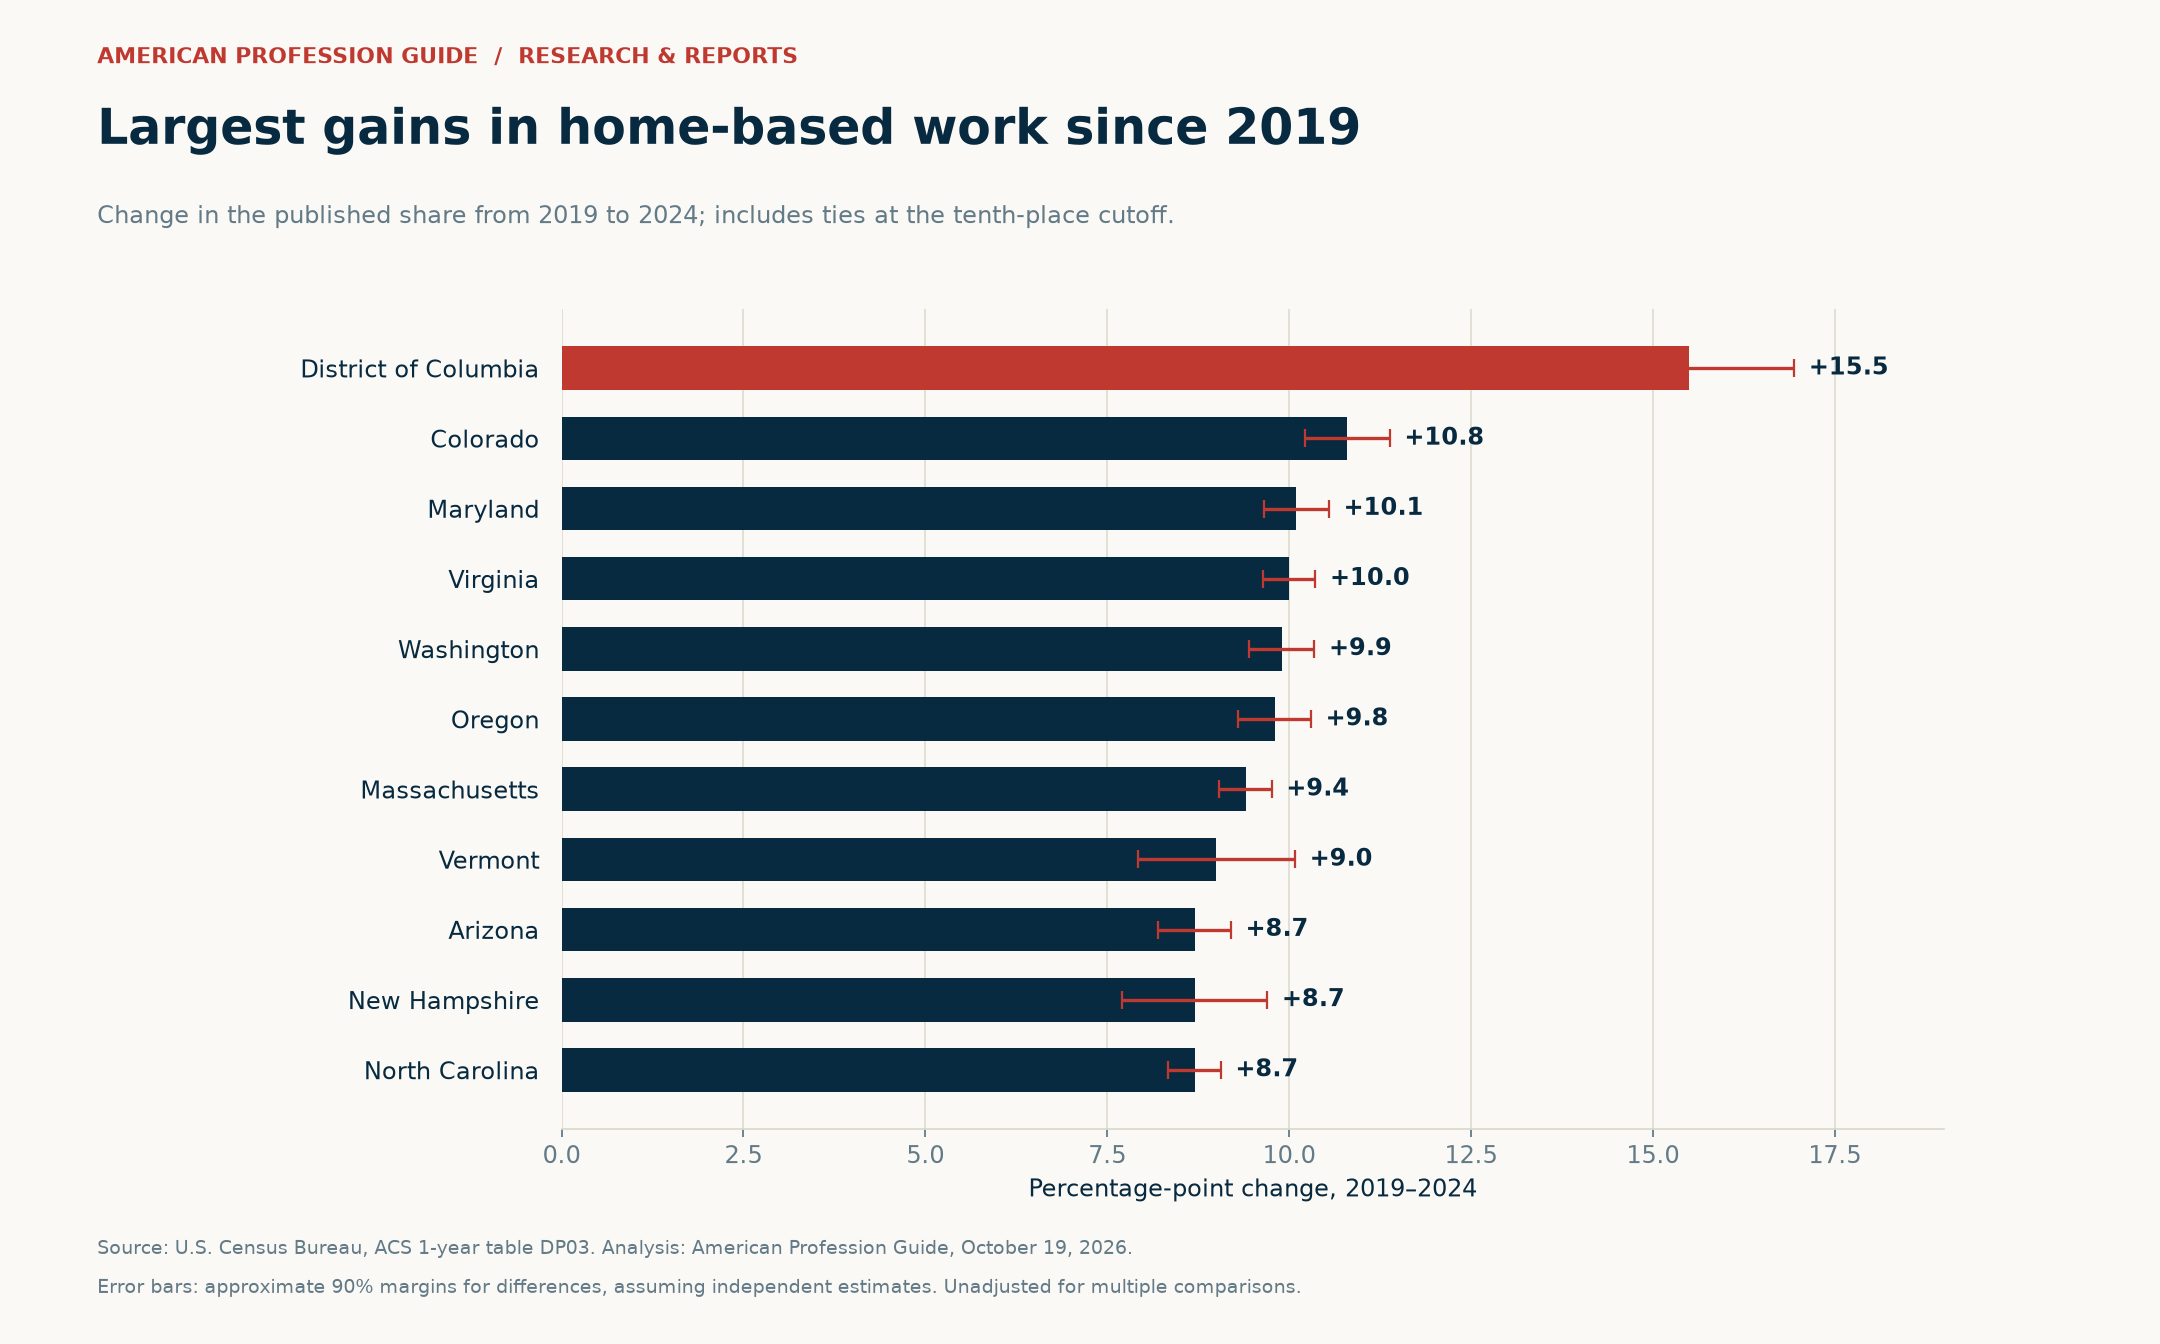
For example, Maryland increased from 5.5% to 15.6%. Subtracting the earlier share gives a 10.1-point change. Calling that a 10.1% increase would be incorrect. A percentage increase would divide the change by the starting share, producing a different number.
All 50 states and D.C. have positive changes from 2019. The smallest published increase is South Dakota’s 1.9 points, from 6.1% to 8.0%. All 51 increases pass the approximate individual 90% test described below. These tests are not adjusted for making many comparisons.
Recent decreases need a different interpretation
Forty-three of the 51 areas have lower published shares in 2024 than in 2023. However, only 20 of those decreases exceed the approximate 90% margin for the difference. Therefore, we do not describe all 43 as statistically established declines. Small changes may reflect sampling variation.
At the national level, the published share fell by 0.5 point, from 13.8% to 13.3%. Its approximate difference margin is 0.14 point using the published margins. This is consistent with the Census Bureau’s commuting summary, which reports a lower work-from-home share in 2024 than in 2023.
Complete work from home by state table
The following tables cover every state and D.C., ordered by the published 2024 share. The ± values apply to the 2024 share and are percentage points. Worker counts are estimates, even though the source publishes them as whole numbers. The downloadable files also include count margins and earlier-year margins.
Shares at or above the national 13.3%
| State or D.C. | 2024 share ± MOE | Home-based workers | 2019 share | Change, points |
|---|---|---|---|---|
| District of Columbia | 22.9% ±1.2 | 88,726 | 7.4% | +15.5 |
| Colorado | 19.9% ±0.5 | 629,420 | 9.1% | +10.8 |
| Oregon | 17.1% ±0.4 | 354,930 | 7.3% | +9.8 |
| Washington | 16.4% ±0.4 | 645,514 | 6.5% | +9.9 |
| Arizona | 16.3% ±0.4 | 582,289 | 7.6% | +8.7 |
| New Hampshire | 16.0% ±0.8 | 120,950 | 7.3% | +8.7 |
| Vermont | 16.0% ±0.9 | 54,357 | 7.0% | +9.0 |
| Virginia | 15.8% ±0.3 | 703,153 | 5.8% | +10.0 |
| Utah | 15.7% ±0.5 | 277,963 | 7.4% | +8.3 |
| Maryland | 15.6% ±0.4 | 504,513 | 5.5% | +10.1 |
| Florida | 15.5% ±0.3 | 1,721,372 | 7.0% | +8.5 |
| North Carolina | 15.4% ±0.3 | 828,181 | 6.7% | +8.7 |
| Georgia | 14.9% ±0.3 | 803,593 | 6.9% | +8.0 |
| Massachusetts | 14.8% ±0.3 | 556,682 | 5.4% | +9.4 |
| Maine | 14.7% ±0.7 | 103,070 | 6.3% | +8.4 |
| Minnesota | 14.7% ±0.4 | 443,318 | 6.4% | +8.3 |
| California | 14.1% ±0.2 | 2,672,106 | 6.3% | +7.8 |
| Pennsylvania | 13.8% ±0.3 | 883,654 | 5.4% | +8.4 |
| Illinois | 13.6% ±0.3 | 857,301 | 5.4% | +8.2 |
| New Jersey | 13.5% ±0.3 | 644,549 | 4.9% | +8.6 |
| Connecticut | 13.4% ±0.5 | 250,606 | 5.6% | +7.8 |
Shares below the national 13.3%
| State | 2024 share ± MOE | Home-based workers | 2019 share | Change, points |
|---|---|---|---|---|
| Delaware | 12.9% ±0.9 | 64,492 | 5.2% | +7.7 |
| Texas | 12.9% ±0.2 | 1,956,349 | 5.7% | +7.2 |
| Idaho | 12.7% ±0.6 | 120,976 | 7.4% | +5.3 |
| Tennessee | 12.7% ±0.4 | 441,140 | 5.6% | +7.1 |
| South Carolina | 12.3% ±0.4 | 316,801 | 5.1% | +7.2 |
| Ohio | 11.9% ±0.3 | 687,025 | 4.6% | +7.3 |
| Missouri | 11.8% ±0.4 | 360,070 | 5.1% | +6.7 |
| New York | 11.8% ±0.2 | 1,124,869 | 4.8% | +7.0 |
| Wisconsin | 11.8% ±0.3 | 360,127 | 5.1% | +6.7 |
| Montana | 11.7% ±0.7 | 66,029 | 6.5% | +5.2 |
| Rhode Island | 11.6% ±0.9 | 65,520 | 4.5% | +7.1 |
| Nevada | 11.3% ±0.6 | 179,164 | 4.9% | +6.4 |
| Michigan | 11.2% ±0.2 | 539,125 | 4.5% | +6.7 |
| Kansas | 10.3% ±0.5 | 153,539 | 5.1% | +5.2 |
| New Mexico | 10.3% ±0.6 | 97,946 | 5.1% | +5.2 |
| Iowa | 9.9% ±0.4 | 162,777 | 5.8% | +4.1 |
| Nebraska | 9.7% ±0.5 | 100,914 | 4.6% | +5.1 |
| Wyoming | 9.7% ±1.0 | 28,679 | 5.7% | +4.0 |
| Indiana | 9.6% ±0.3 | 323,341 | 4.3% | +5.3 |
| Kentucky | 9.5% ±0.4 | 197,124 | 4.3% | +5.2 |
| Hawaii | 8.9% ±0.7 | 63,594 | 4.8% | +4.1 |
| Oklahoma | 8.9% ±0.3 | 167,486 | 4.4% | +4.5 |
| West Virginia | 8.8% ±0.6 | 66,915 | 3.9% | +4.9 |
| Arkansas | 8.6% ±0.4 | 119,058 | 3.5% | +5.1 |
| Alaska | 8.4% ±0.8 | 30,477 | 4.3% | +4.1 |
| Alabama | 8.3% ±0.4 | 193,754 | 3.4% | +4.9 |
| Louisiana | 8.0% ±0.3 | 163,353 | 3.9% | +4.1 |
| South Dakota | 8.0% ±0.6 | 38,257 | 6.1% | +1.9 |
| North Dakota | 7.1% ±0.7 | 29,953 | 3.6% | +3.5 |
| Mississippi | 6.2% ±0.4 | 81,270 | 3.1% | +3.1 |
How to use these findings in career research

Use the state share to understand how common home-based work is among resident workers. Use the count to understand the scale of that workforce. Neither tells you whether a particular employer will let you work remotely or whether a job offer permits residence in another state.
Before choosing a location, check the actual role, required office days, approved work locations, and compensation. Statewide statistics cannot replace those terms. Likewise, a high home-based work share does not establish that a location is affordable or suitable for a particular household.
Our salary purchasing power study provides a separate regional wage-and-price comparison. The job growth study compares national growth with annual openings. Meanwhile, our careers without a bachelor’s degree report examines entry routes and historical pay.
You can also consult our occupational gender pay gap analysis for another earnings perspective. These studies use different sources and populations. Read their definitions before combining findings, especially when comparing ACS workers with BLS wage and salary worker measures.
Methodology and statistical notes
We downloaded the official ACS one-year DP03 tables through data.census.gov on October 19, 2026. The analysis uses 2019 and 2021–2024. We retained the national estimate, all 50 states, and D.C., giving 52 geographic records per year and 260 records overall.
- Variables: The worker denominator is DP03_0018E. Home-based worker counts use DP03_0024E. For published percentages, we use DP03_0024PE. The matching M and PM fields provide margins of error.
- Consistent period: all records are one-year estimates. We do not mix them with five-year rolling estimates or the experimental 2020 series.
- Geography: state statistics describe residents. D.C. remains labeled separately; Puerto Rico and other territories are excluded.
- Ordering: share rankings use the published one-decimal percentages. Alphabetical order breaks display ties without implying a statistical difference. The change chart includes all ties at its cutoff.
- Calculations: percentage-point changes subtract published percentages. Shares of the national home-worker count divide state counts by the national count. We do not average state percentages to construct the national figure.
How we handle margins of error
The published margins use a 90% confidence level. We show them directly beside the latest state shares and as chart error bars. For a difference between two annual shares, our approximate margin is the square root of the sum of their squared margins. This assumes independent estimates and does not include covariance.
Our individual significance screen asks whether the absolute change exceeds that difference margin. Equivalently, the approximate 90% interval for the change excludes zero. For example, the national 2023–2024 margin is √(0.1² + 0.1²), or about 0.14 point. The 0.5-point decline exceeds that threshold.
These calculations follow the approach underlying the Census statistical testing guidance. We use rounded published estimates and margins, so borderline results should be treated cautiously. We have not adjusted the tests for multiple comparisons and do not claim simultaneous confidence across all states.
Finally, margins of error address sampling uncertainty. They do not capture every reporting, coverage, or processing error. Annual estimates also describe different populations in different years. They cannot trace individual workers, identify employer policy changes, or explain the causes of a state’s trend.
Data files and suggested citation
Download the Census work-from-home extract (CSV): 260 records for 52 geographies across five years, including counts, percentages, margins of error, and source URLs. Download the 51-area state comparison file (CSV): 2024 estimates, 2019 and 2023 comparisons, calculated differences, and approximate significance flags.
Suggested citation: American Profession Guide, “Work From Home by State: 2024 Rankings and the Shift Since 2019,” 2026 research edition. Analysis of U.S. Census Bureau, American Community Survey one-year table DP03, 2019 and 2021–2024. Accessed October 19, 2026.
Publishers may reuse APG’s original charts with attribution and a link to this study. Please retain the data years, the usual-work-location definition, and the uncertainty notes. The featured and interior illustrations were generated with AI. The five statistical charts come from the cited Census tables and reproducible calculations.


