




The engineering vs software job market in 2026 sends different signals depending on what you measure. Mechanical engineering’s total-postings index stood at 168.7 on October 16, while software development’s was 78.9. Yet total software advertisements rose 21.3% from a year earlier. A sector can remain below its old baseline while recovering over the latest year.
Checked October 26, 2026. We analyzed Indeed Hiring Lab’s official U.S. data for four engineering categories and software development. Five charts separate baseline position, annual momentum, fresh advertisements and advertised pay. These are posting signals, not completed hires, absolute vacancy counts or a promise that your next application will succeed.
Engineering vs software job market in 2026: the baseline
The October 22 Hiring Lab snapshot highlights engineering strength. Our comparison uses its underlying sector file, frozen at repository revision d908431fc78bb4587301ab7331d98404996f7fc4. The latest observation is October 16, 2026. The index sets each sector’s own February 1, 2020 posting level to 100.
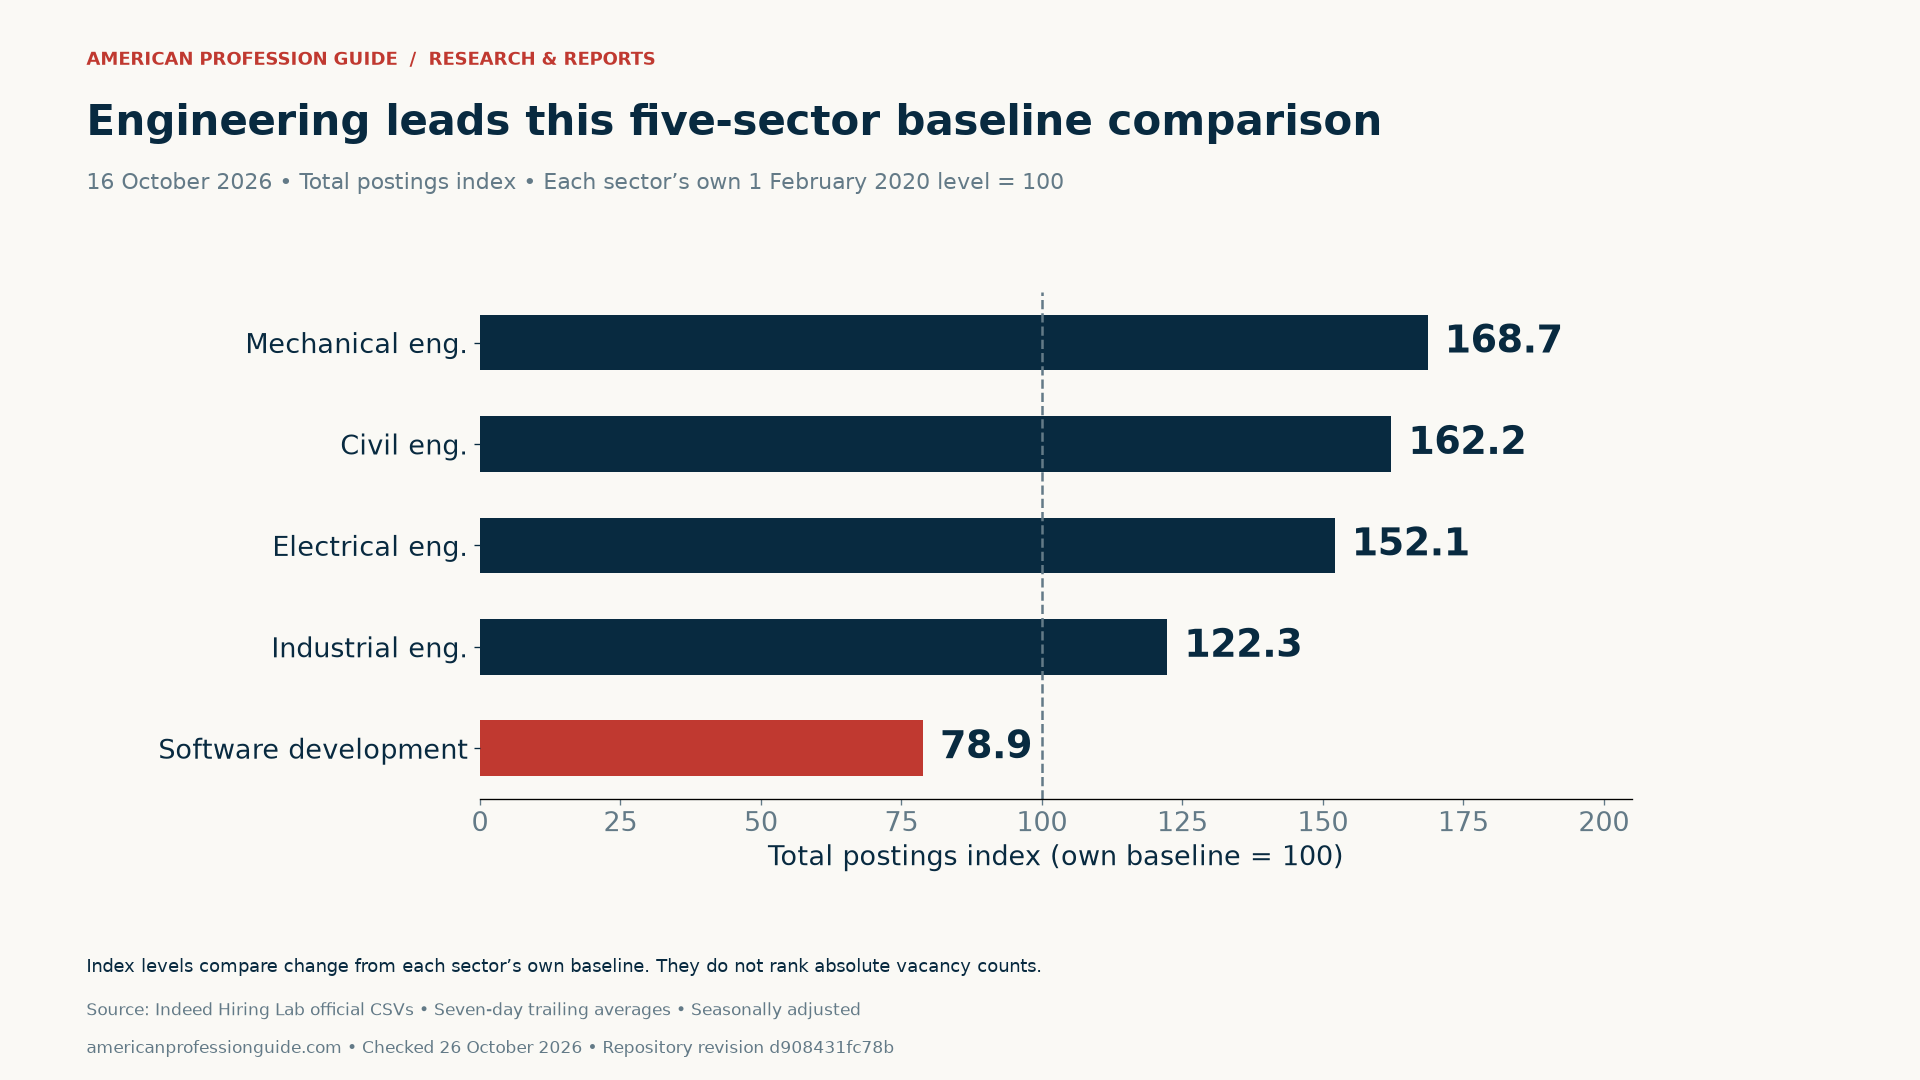
For example, mechanical engineering’s 168.66 means its indexed total advertisements were 68.66% above its own baseline. Software’s 78.86 means 21.14% below its own baseline. You cannot divide these indices to establish how many engineering jobs exist for every software job. The starting numbers of advertisements differ and are not supplied by this normalized comparison.
The four engineering categories are distinct Indeed sectors. Their labels are not interchangeable with the whole engineering workforce. Likewise, software development does not cover every technology role. We chose these five categories to answer the brief’s comparison question, rather than rank all occupations or identify the “best” profession.
Baseline position and annual momentum are different
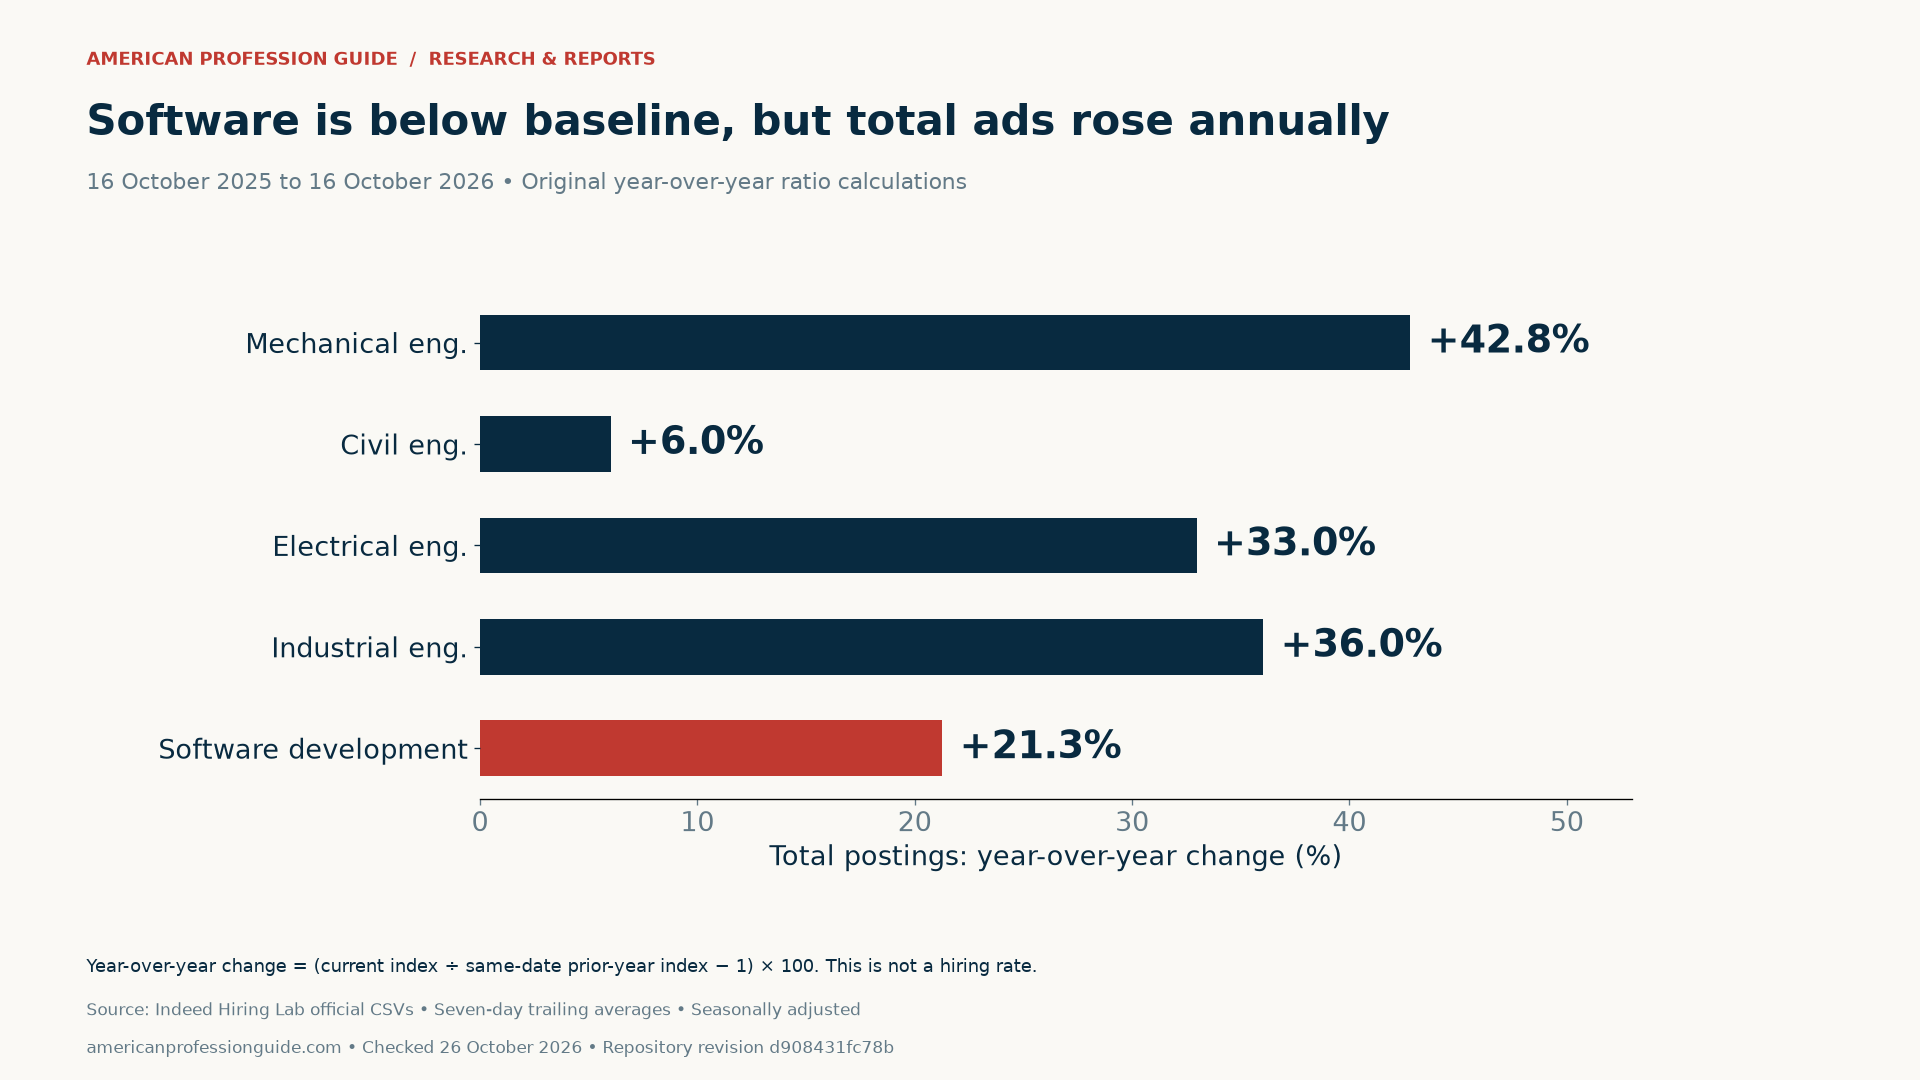
We calculate annual change as (October 16, 2026 index ÷ October 16, 2025 index − 1) × 100. Software’s total index rose from 65.03 to 78.86, yielding 21.3%. Civil engineering rose from 153.01 to 162.20, yielding 6.0%. Civil remained much further above its 2020 baseline, despite its smaller recent percentage increase.
| Indeed sector | Total index, Oct. 16, 2026 | Annual total change | Annual new-ad change |
|---|---|---|---|
| Mechanical engineering | 168.66 | +42.8% | +19.6% |
| Civil engineering | 162.20 | +6.0% | −1.0% |
| Electrical engineering | 152.13 | +33.0% | +13.1% |
| Industrial engineering | 122.32 | +36.0% | +7.0% |
| Software development | 78.86 | +21.3% | −1.6% |
Reading the two measures together avoids a false choice between “strong” and “weak.” A low level with positive momentum can describe a partial recovery. A high level with slow momentum can describe a sector that retained more of its earlier gains. Neither combination determines the number of suitable employers within your location, specialty or experience band.
Fresh advertisements can tell a different story
Indeed defines new postings here as advertisements on the platform for seven days or fewer. The annual calculation for this series produces a different picture: civil engineering’s new-postings index slipped about 1.0%, while software development’s declined about 1.6%. Their total-advertisement indices nevertheless increased over the same dates.
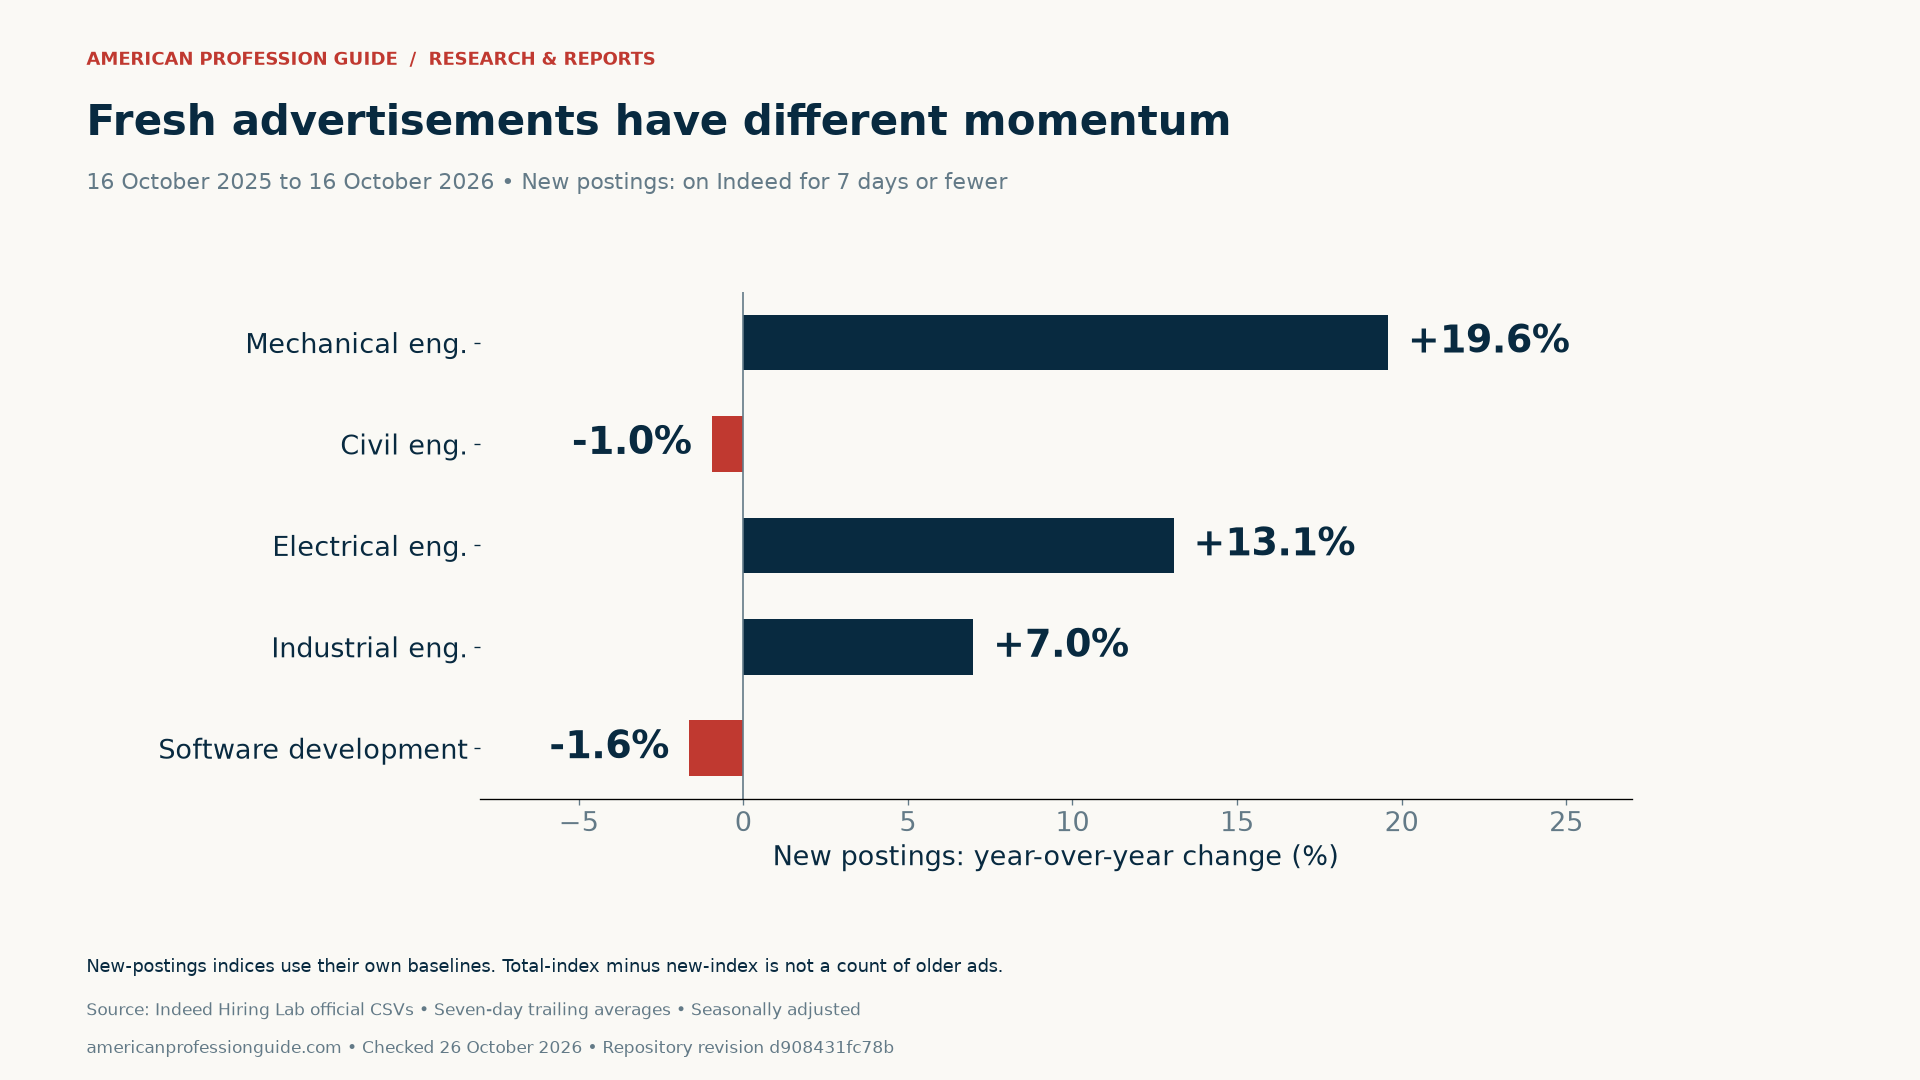
Do not subtract a new-postings index from a total-postings index to estimate older ads. Each series has its own baseline. Their numerical difference does not supply an advertisement count. Similarly, a total inventory can change as ads enter, remain visible or disappear. This analysis does not identify the reason behind each movement.
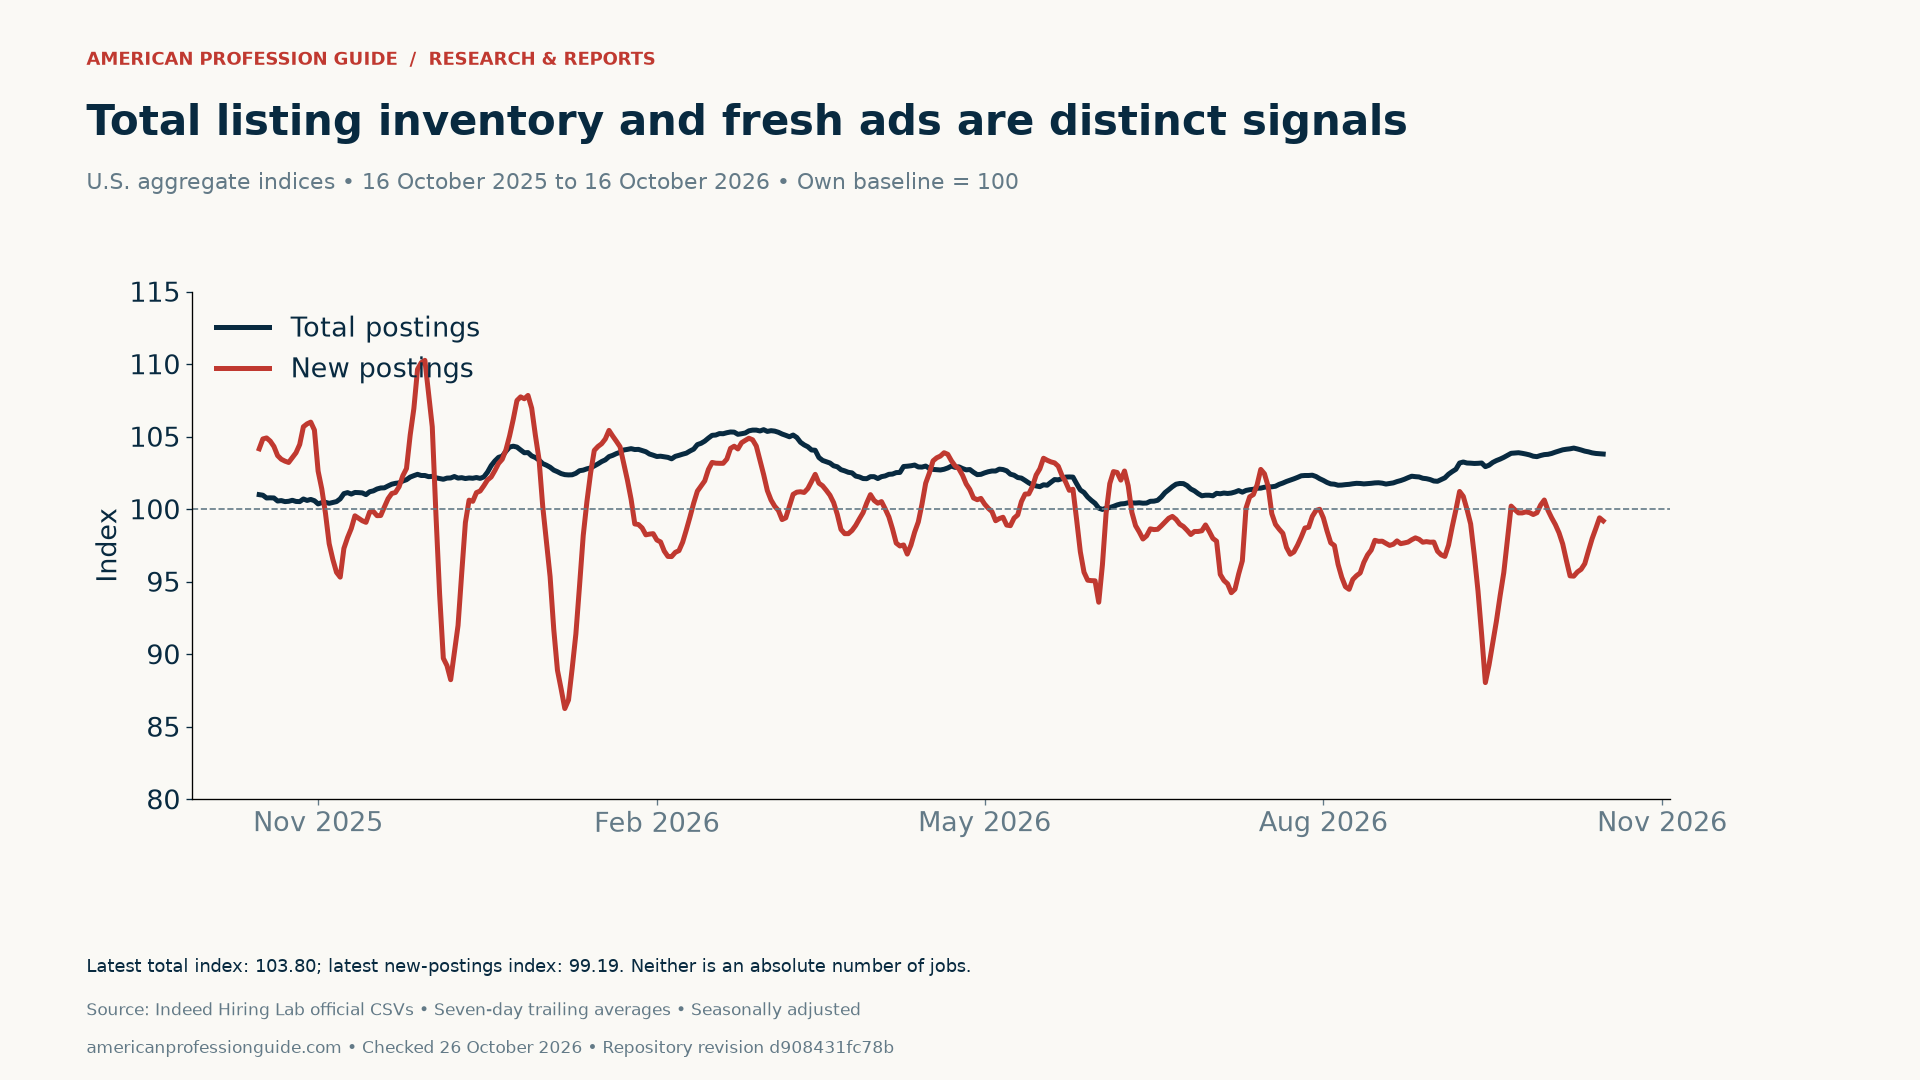
For context, the nationwide total index was 103.80 on October 16. The new-postings index was 99.19, which rounds to the snapshot’s 99.2. Comparing fresh ads alongside inventory helps frame a search, but short-term variation remains visible even after averaging. Neither line says how many applicants compete for a particular opening.
Advertised pay adds context, not a guaranteed raise
The same October snapshot reports September advertised-wage growth of 5.6% in electrical engineering and 2.4% overall. The publisher controls for job titles when measuring these advertised pay changes. This is a separate period and measure from the October postings indices. It does not describe wage increases received by existing employees.
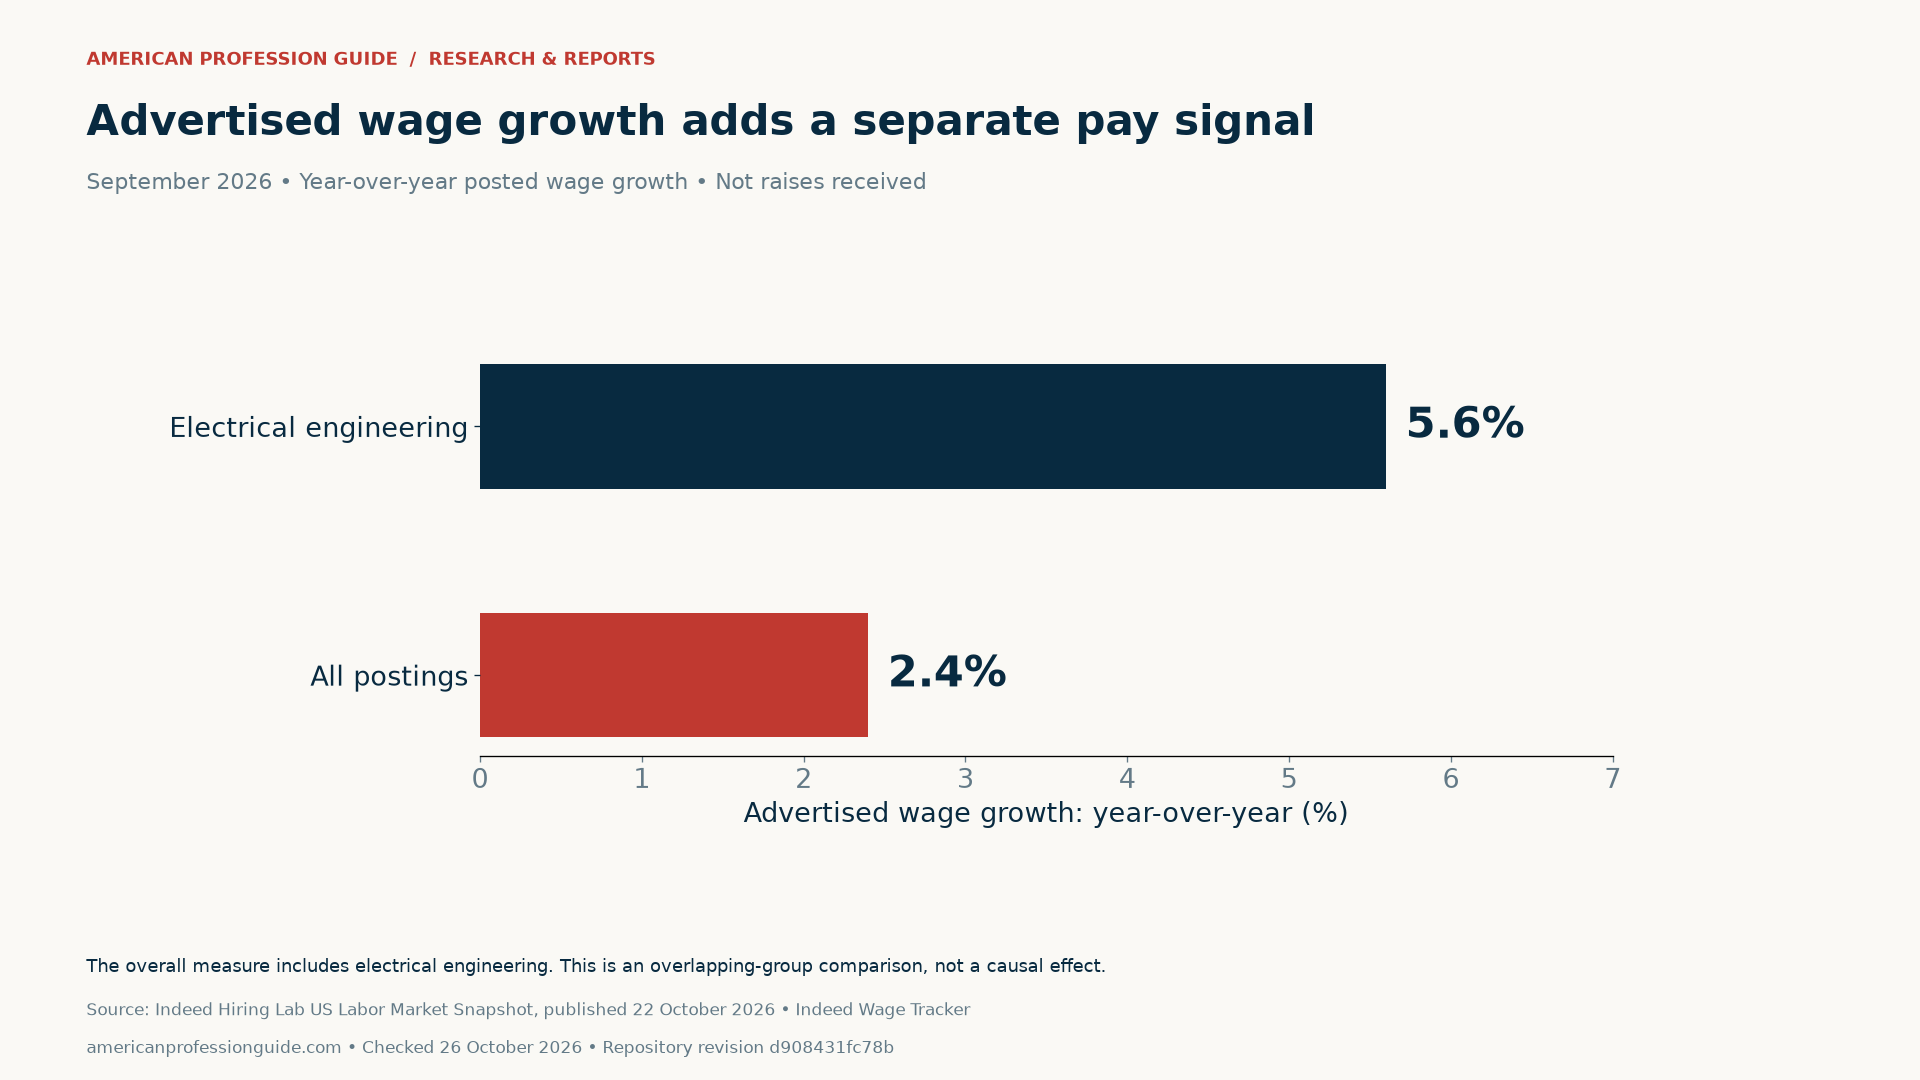
For a real role, check the pay range, location, hours, benefits and experience requirement. Record whether the advertised figure is hourly or annual and whether it is a base-pay range or broader compensation. A sector-wide growth rate cannot replace the actual terms of an offer. Our metro purchasing-power research helps explain why location belongs in that comparison.
Translate sector labels into an employer shortlist

The publisher’s title examples provide useful orientation. Its categories are based on normalized job titles, rather than a one-to-one match with formal BLS occupations. The examples below are classification examples, not a list of open roles or a complete definition of each sector.
| Indeed category | Publisher’s example titles |
|---|---|
| Civil Engineering | Civil engineer; environmental health and safety specialist |
| Electrical Engineering | Electrical engineer; controls engineer |
| Industrial Engineering | System engineer; process engineer |
| Software Development | Software engineer; full stack developer |
Start with roles whose requirements match your evidence. Then inspect current employer listings, verify the location and date, and record required skills and credentials. Compare several employers before treating one advertisement as representative. Use the blank worksheet to track source links and follow-up dates. It contains no scraped applicant data or real vacancies.
If a role requires further education, examine the credential and program evidence separately. Our graduate-degree earnings analysis shows why a broad national pay gap cannot establish your return from a particular course. A posting index likewise cannot establish that a new qualification will secure an offer.
Methods, revisions and downloadable comparison
The official repository methodology states that these daily series use seven-day trailing averages. Each series is seasonally adjusted separately. The methodology adopted in November 2024 revised historical values. Future downloads may therefore differ from this frozen version. We retain the revision, original files and file hashes for reproducibility.
Our analysis selects the five named sectors and keeps total and new postings separate. We checked date-sector-type uniqueness and compared the same calendar date one year apart. We use the published index values directly: a reading near 100 is an index level, not a percentage to which another 100 should be added. Percent changes in this article use ratios of the retained two-decimal inputs; displayed results are rounded.
The Indeed data FAQ explains that its advertisements do not precisely count available jobs. Ads can cover multiple openings, remain visible after filling, or miss jobs advertised elsewhere. Platform coverage and classification also matter. We do not infer AI caused the divergence, estimate applicant competition or claim statistical significance from these series.
Download the engineering and software comparison data (CSV) and the blank technical job search worksheet (CSV). Underlying repository data are shared under CC BY 4.0. Credit Indeed Hiring Lab for the data and American Profession Guide for the selected comparison, calculations and charts.
Suggested citation: American Profession Guide, “Engineering vs. Software Hiring in 2026: What Fresh Job Ads Say About Your Search,” checked October 26, 2026. Observations through October 16, 2026; same-date annual comparisons with October 16, 2025. Preserve the baseline, adjustment, posting-type and platform-coverage notes when reusing a figure.


