






Using AI job forecasts for career planning can become costly when a global headline drives a rushed training decision. Before buying a course or abandoning a field, check what the forecast counts and what your next role actually requires.
A new Gartner forecast is a useful reading exercise. Its November 10 release projects more jobs created than removed worldwide through 2030. However, it also distinguishes delayed hiring and transformed work. Those categories should stay separate.
Evidence checked November 12, 2026. All forecast figures below are worldwide projections, not completed U.S. employment outcomes. No local posting study has been conducted for this article.
AI job forecasts: reconcile the career-planning headline
Gartner’s primary announcement forecasts 10.6 million jobs created and 8.9 million removed worldwide by 2030. Its net increase reconciles as 10.6 − 8.9 = 1.7 million jobs.
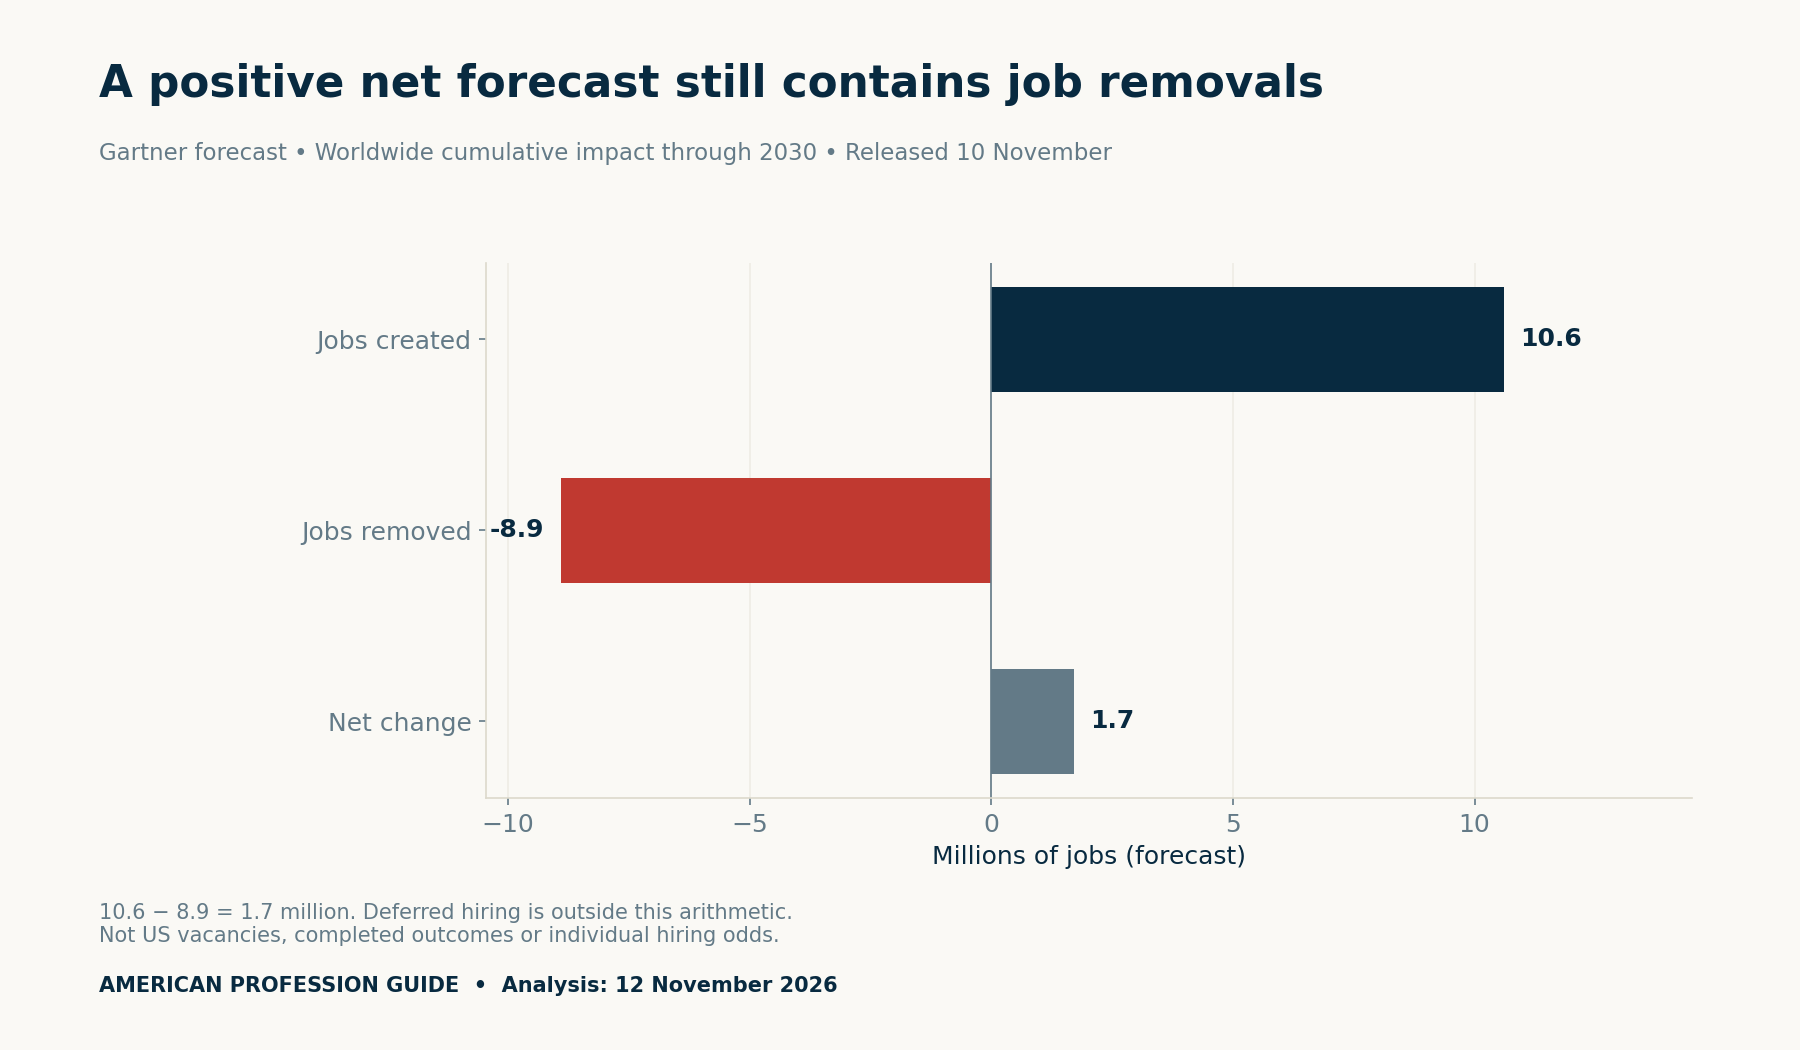
A positive net does not mean nobody loses work. Equally, the removal figure alone leaves out the roles the same forecast expects to create. Keep both gross components beside the net when discussing the headline.
For a U.S. reader, geography is another boundary. These global totals do not identify openings in your occupation or city. They also do not tell you whether you meet an employer’s requirements today.
Keep deferred hiring outside the net calculation
The release separately projects that five million people will have experienced delayed hiring by 2030. That describes positions not created as planned. It is conceptually different from removing an occupied job.
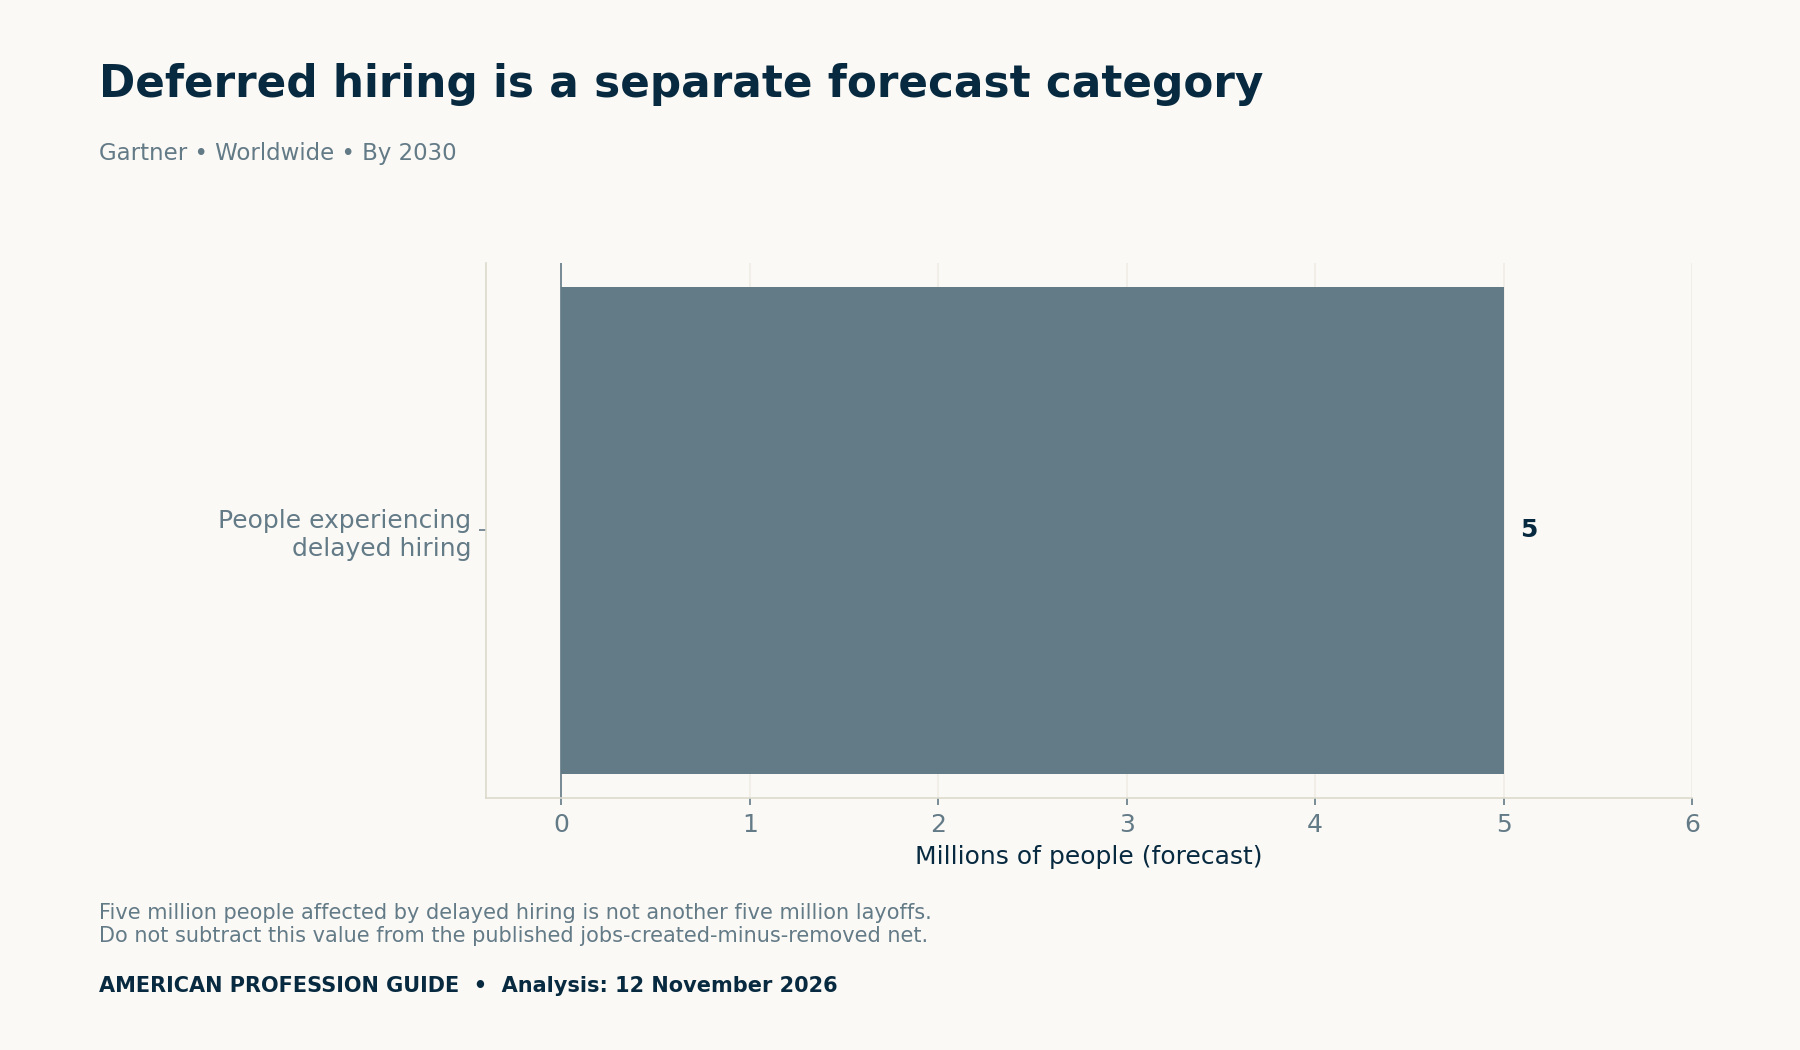
Therefore, do not subtract the delayed-hiring figure again from the published created-minus-removed net. Also, do not label that group five million layoffs. The distinction matters for readers trying to understand why a positive long-term forecast might coexist with fewer entry routes in a particular search.
That practical interpretation is a question to investigate, not proof that your own application was affected by AI. A delayed response, a closed advert and an employer’s explicit hiring freeze are different evidence states.
Distinguish task transformation from job removal
Gartner also expects changes to work for more than 20% of workers. A change in tasks is not the same event as losing a job. Avoid turning an exposure or transformation percentage into a personal layoff probability.
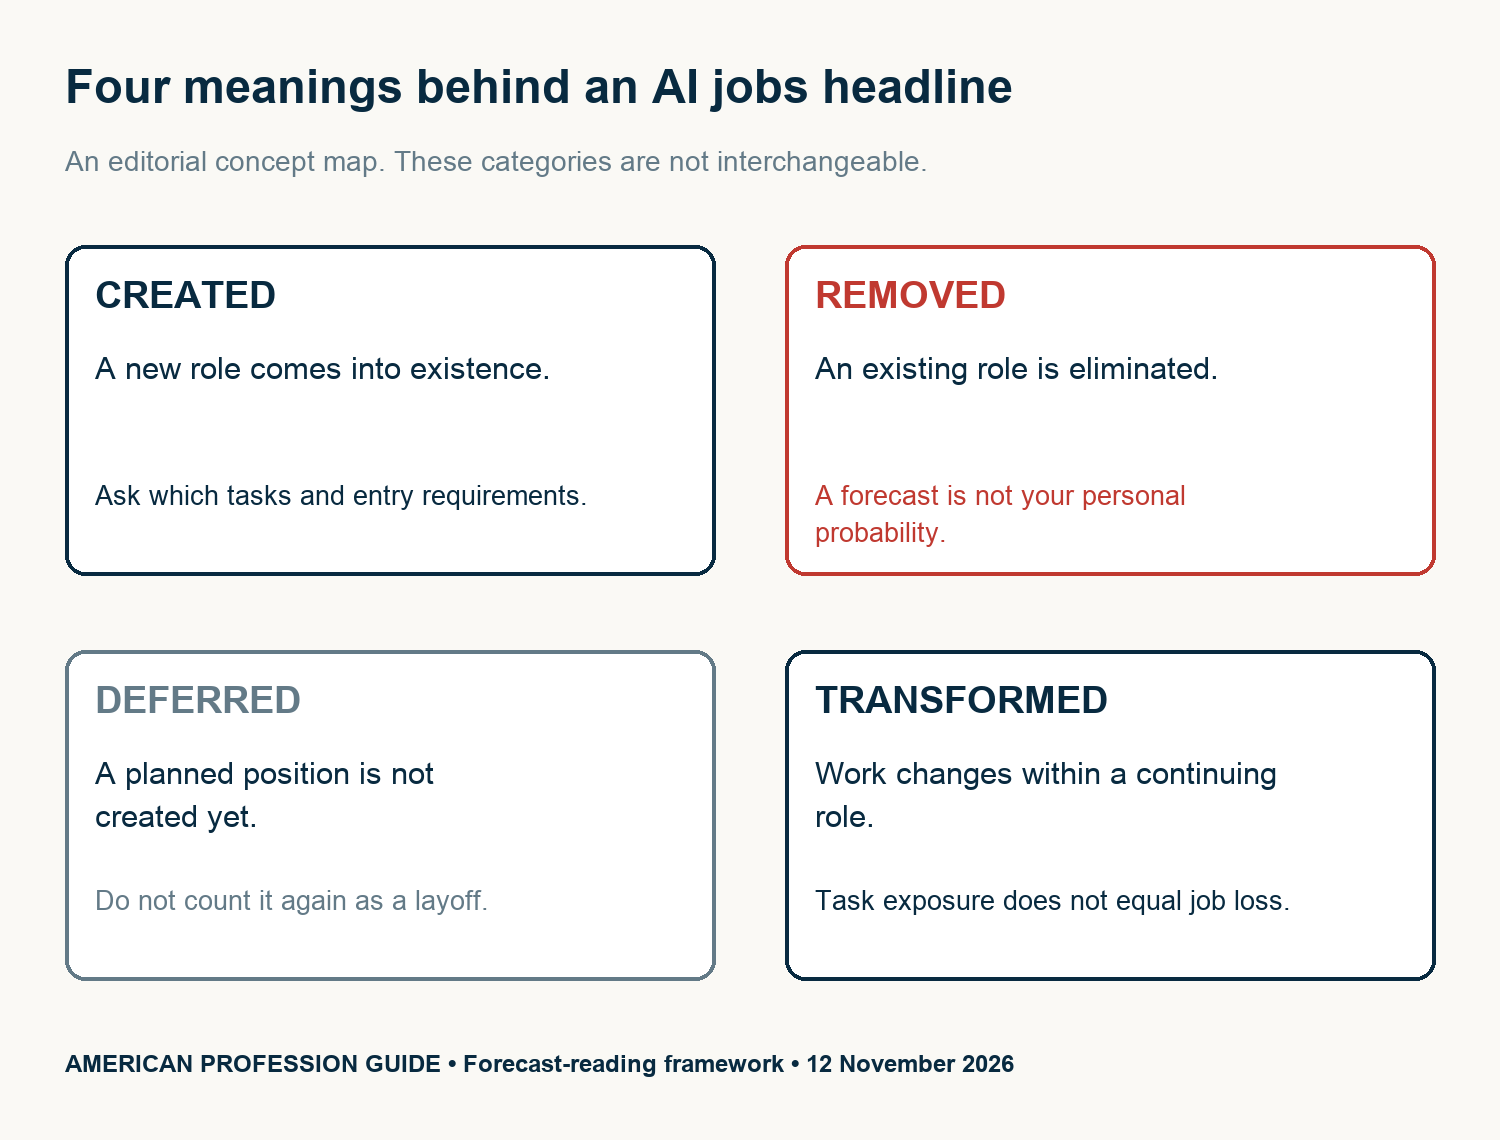
The concept map separates four questions. Is a role created, removed, deferred or changed? Once you identify the category, check the unit, geography and time horizon. A count of jobs, a count of affected people and a percentage cannot form one additive total.
This distinction can make a career conversation more specific. Instead of asking whether an occupation is “safe,” ask which tasks are changing, who reviews the output and which responsibilities still require human judgment.
Our questions about an employer’s AI expectations provide a role-specific starting point for that conversation.
Selected industry examples are not the entire forecast
The announcement highlights asset-intensive industries, the public sector and technology. The chart below calculates created minus removed within those selected examples. They point in different directions.
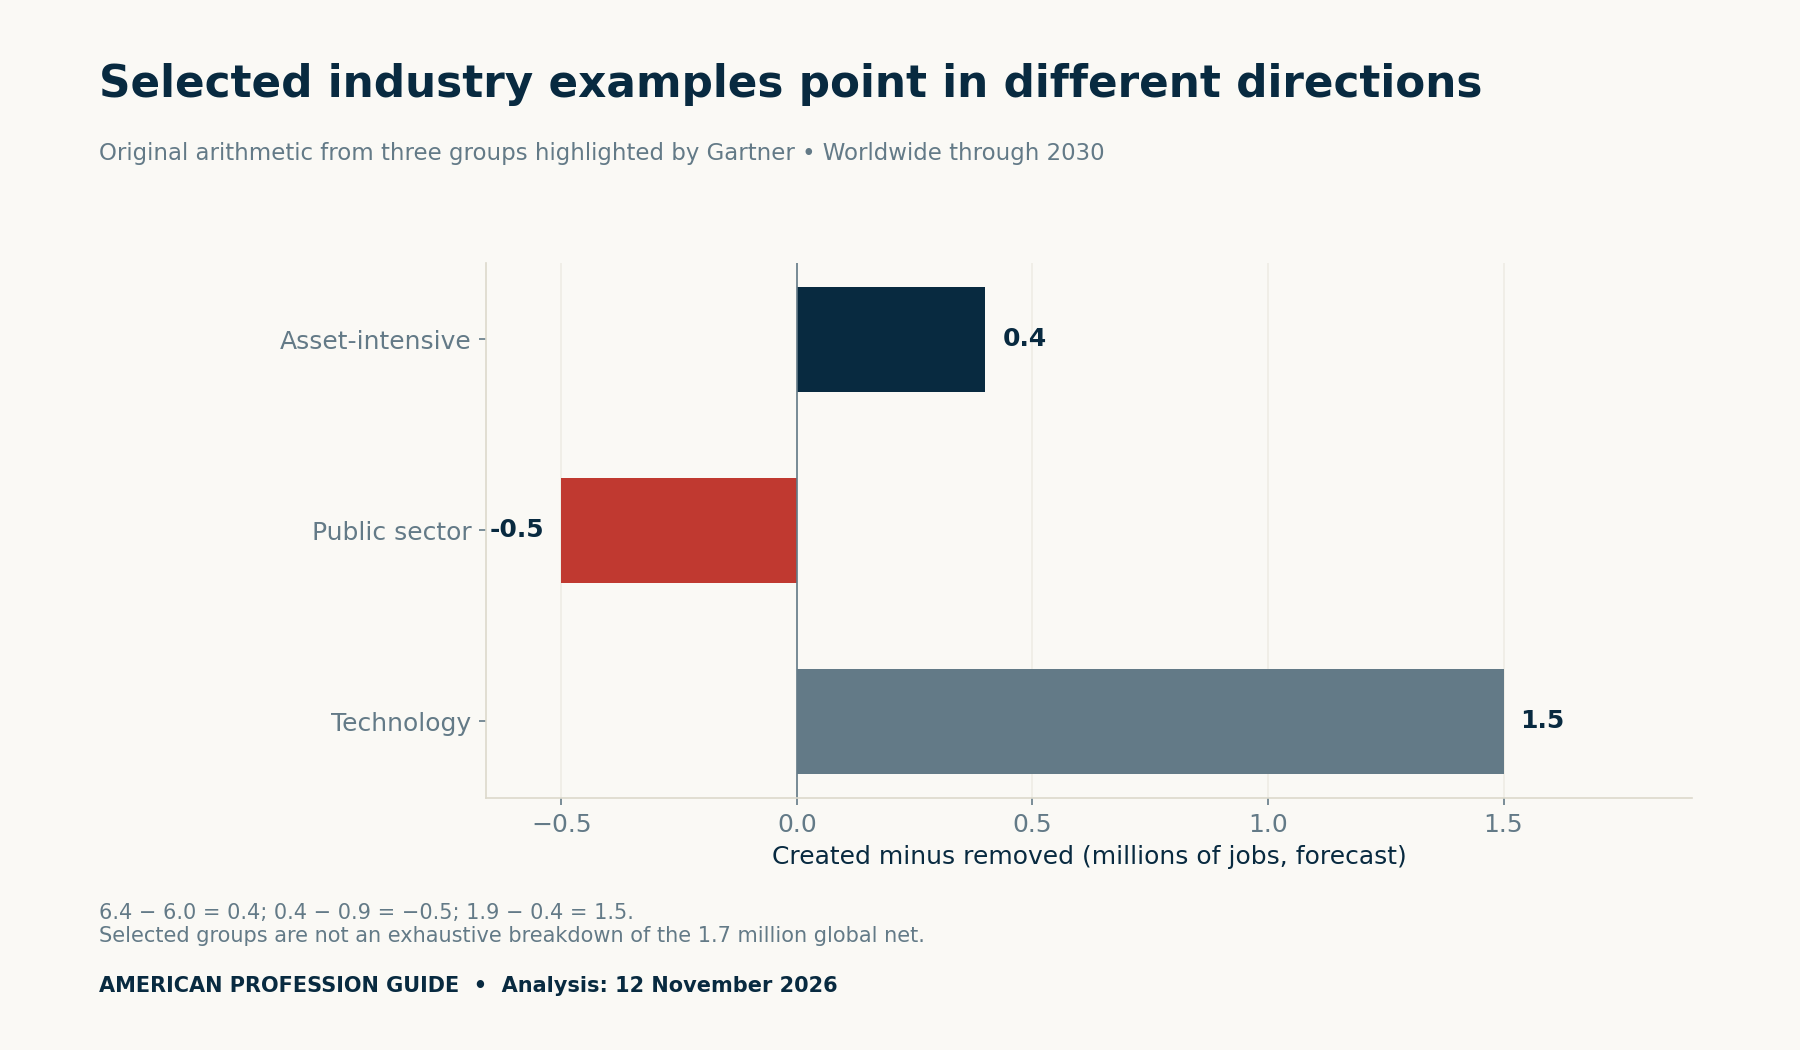
Do not treat those three groups as an exhaustive breakdown of the global total. Their displayed net changes sum to 1.4 million, while the overall published net is 1.7 million. The remaining difference does not identify an unnamed industry or its hiring opportunities.
Similarly, an industry label is not a complete description of a worker’s occupation. A company can employ many kinds of specialists. Read the actual task requirements before applying a sector forecast to your role.
What the public release cannot reproduce
We can reproduce the headline subtraction. We cannot independently reproduce Gartner’s underlying employment forecast from the public announcement. It does not supply all model inputs and assumptions needed for that exercise.
Our forecast-audit file makes that distinction explicit. It records the publisher, release, worldwide scope, horizon, unit and method availability. An unavailable input stays unavailable; it does not become a guessed value to make a spreadsheet look complete.
This limitation does not prove the forecast is wrong. It defines what a reader can audit using this public source. Forecasts may change as adoption, policy, business decisions and other conditions change.
Turn AI job forecasts into a bounded career check
For career planning, move from a global claim to evidence you can inspect. Choose one U.S. occupation, one location and a declared seven-day collection period. Then review a fixed set of official employer adverts.
The downloadable register provides space for twenty postings. It is blank, and we have not collected that sample. If you use it, publish or retain your inclusion rules before interpreting the results.
- Record the employer, official URL, retrieval date and requisition ID.
- Separate required skills from preferred skills.
- Copy explicit task and AI responsibilities without embellishing them.
- Record experience, location and access constraints.
- Deduplicate requisitions and preserve closed or unclear cases.
A convenience sample may help you identify questions. It cannot establish a national demand rate, an individual job-loss probability or the value of a course. Also, one requisition can cover several hires, so adverts and headcounts are different units.
Check the learning decision before paying
Link each proposed course to a verified skill gap. Then name a work sample that could demonstrate the skill. Record quoted tuition, other costs, study time, prerequisites and schedule constraints in the decision sheet.
Keep an unverified salary premium blank. A provider’s placement claim also needs its own denominator, period and eligibility rules. Do not assume that learning a tool guarantees protection from employment change.
A small, reversible learning experiment may help answer a specific question. For example, agree on one permitted task and an acceptance standard before evaluating a tool. Avoid uploading confidential employer work to an unapproved service.
For documenting that experiment, our productivity evidence guide explains accepted work, rework and total time. Its fictional examples teach arithmetic rather than promise career results.
Download the forecast-reading tools
These four CSV files separate source facts and arithmetic from future collection. The posting and retraining sheets contain no observed vacancies, course prices or placement outcomes.
- Forecast source ledger (CSV)
- Calculations and public-method audit (CSV)
- Blank twenty-posting review (CSV)
- Blank retraining decision sheet (CSV)
Methods, limits and reuse
We checked the November 10 primary announcement, transcribed its units and calculated the global and selected-group nets. We kept deferred hiring outside the jobs-created-minus-removed arithmetic. Values retain the precision supplied by the publisher.
The three statistical charts answer distinct questions: the overall gross and net forecast, delayed hiring as a separate category, and non-exhaustive industry examples. Additional repetitions of the same totals would not improve the evidence.
The practical framework is editorial guidance, not a completed employment or retraining study. No local posting sample, employee interview or course-outcome test was conducted. Cite the source, release date, worldwide scope and forecast horizon when reusing a figure, and retain the distinction between projections and observed outcomes.


