






AI accounting estimate documentation is a practical skill: can someone follow your inputs, challenge your assumptions and reproduce the arithmetic? A convincing portfolio shows that trail. A list of AI tools does not show it on its own.
This report pairs a recent finance-leader survey with a fully fictional cash-flow exercise. You can download the source table, recalculate the example and adapt a blank evidence register. Every cash amount below is invented for learning; no client information is used.
What the November survey actually measures
BDO’s 4 November 2026 release covers 200 senior finance leaders at U.S. companies with annual revenue of $250 million–$10 billion and annual external audits. Rabin Roberts Research conducted fieldwork on 6–28 August 2026. Publication and measurement dates therefore differ.
Respondents reported 99% adoption for at least one AI-informed estimate or judgment reviewed by an external auditor. Full supportability was 49%; another 46% could explain most outputs but retained gaps. These are self-reports within that selected company group, not a census of American accounting teams.
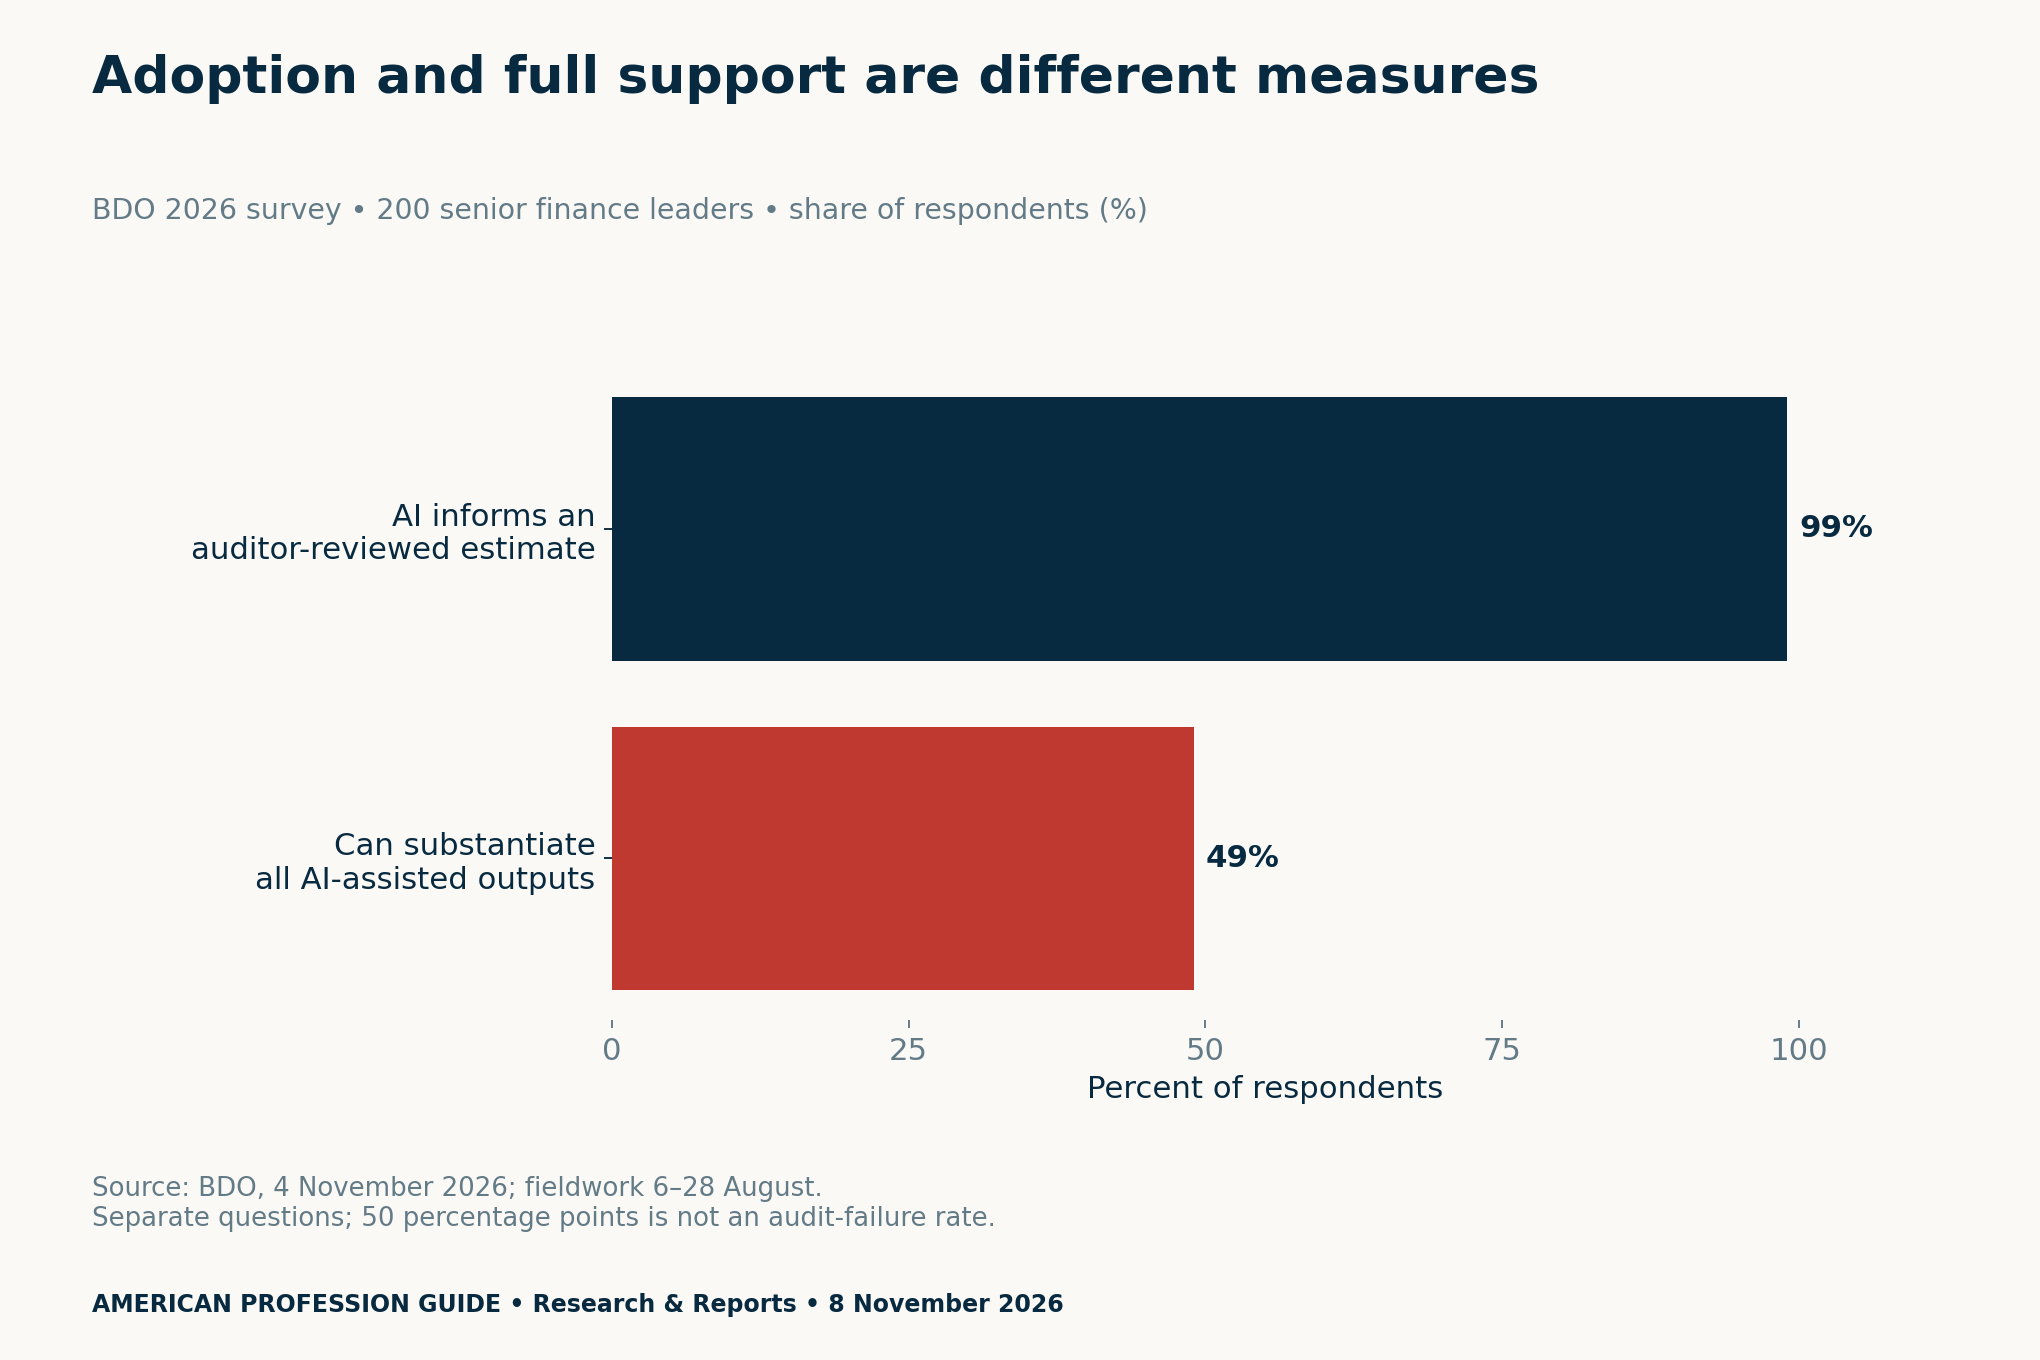
The survey overview also distinguishes readiness from documentation. A confident answer is not a completed evidence file. Without respondent-level cross-tabs, we cannot establish which organizations appear in both groups.
AI accounting estimate documentation: build the evidence pack
Start with the question and the period. For this exercise, the question is simply how much cash a fictional business may have at period-end. It is not a fair-value measurement, impairment test or complete financial statement. A useful file also explains what the estimate excludes.
Keep six connected components. First, retain input sources and units. Next, state assumptions and who owns them. Preserve the model or tool version and relevant settings. Then recalculate independently, vary assumptions and record the reviewer’s challenge. Together, those records make your reasoning easier to inspect.
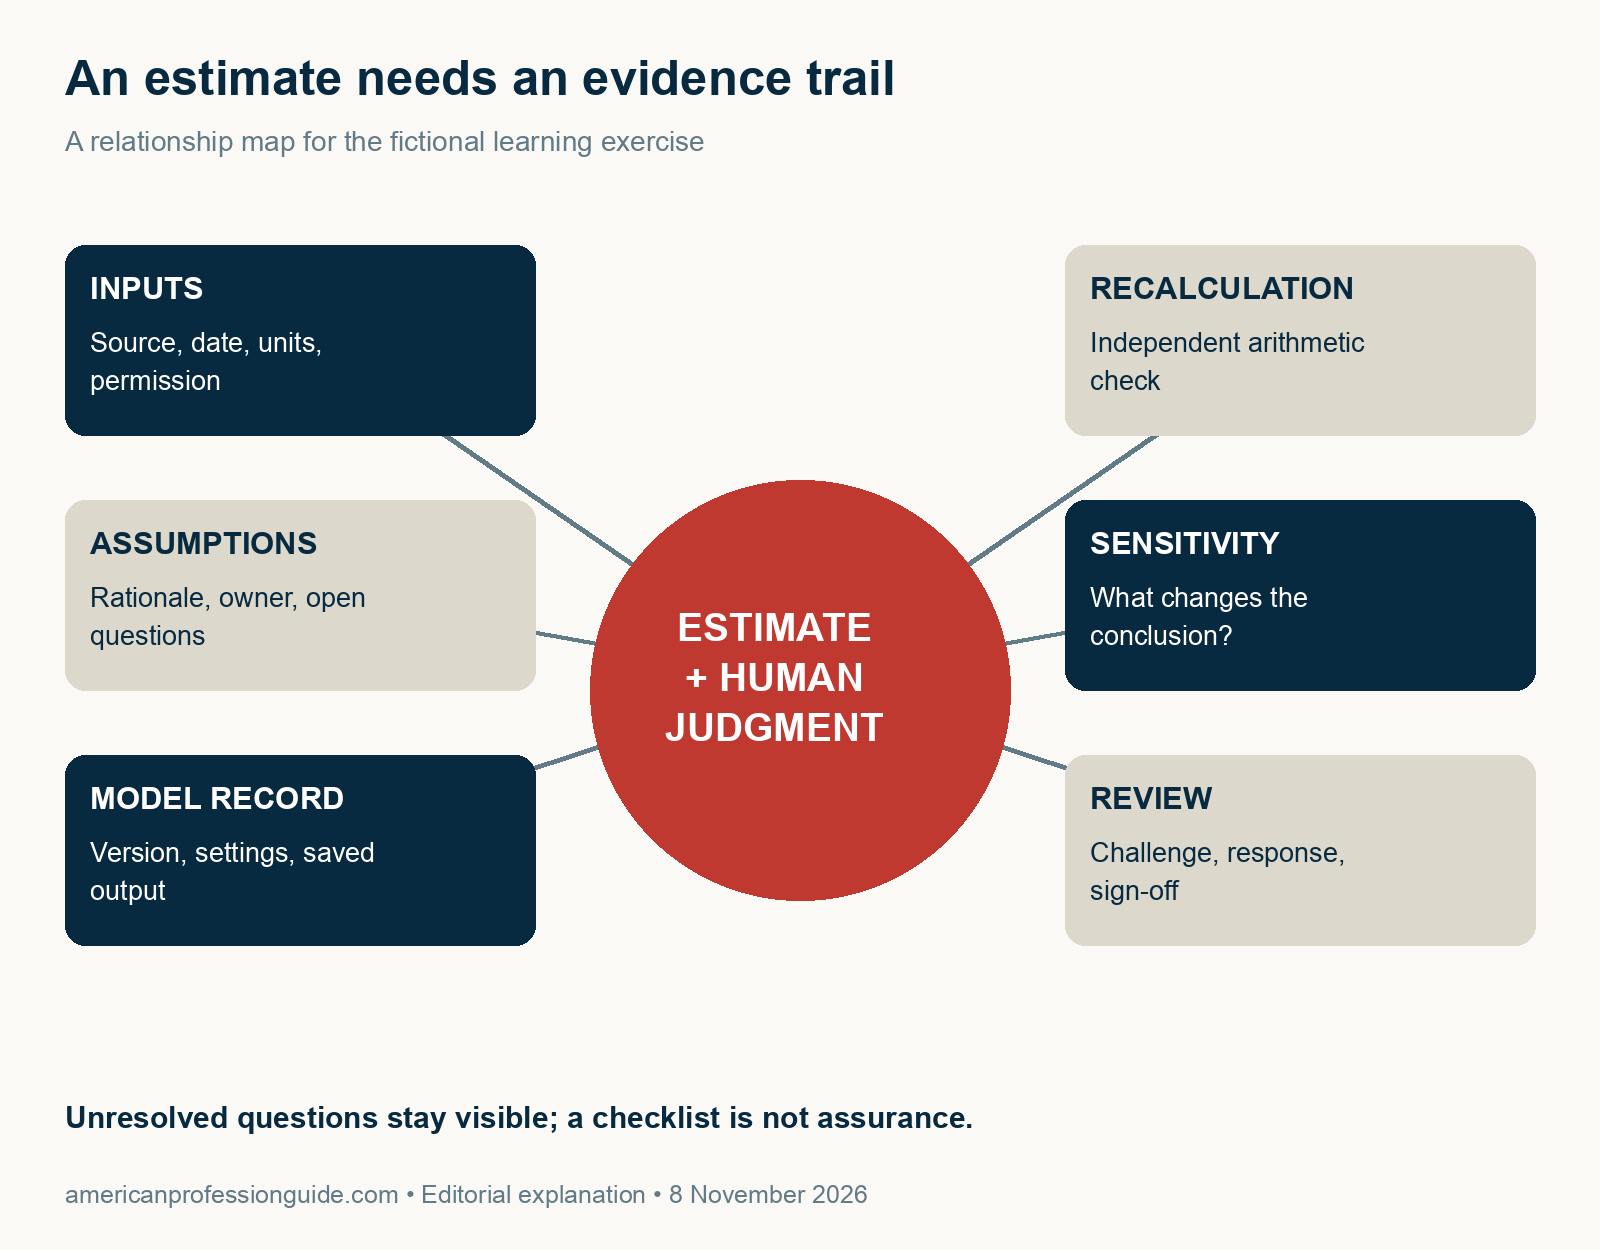
Do not fill an empty source field with a confident guess. Instead, mark it unresolved and name the person who can clarify it. For a real workplace task, follow your organization’s approved tools, confidentiality rules and review process. Use only synthetic or expressly permitted material in a public portfolio.
Check your accounting estimate arithmetic
Assume beginning cash of $20,000, receipts of $80,000 and payments of $65,000 for one invented period. Use a single currency and consistent period boundaries. The closing balance is $35,000: beginning cash plus receipts minus payments.
| Fictional item | US dollars | Treatment |
|---|---|---|
| Beginning cash | 20,000 | Starting balance |
| Receipts | 80,000 | Add |
| Payments | 65,000 | Subtract |
| Ending cash | 35,000 | 20,000 + 80,000 − 65,000 |
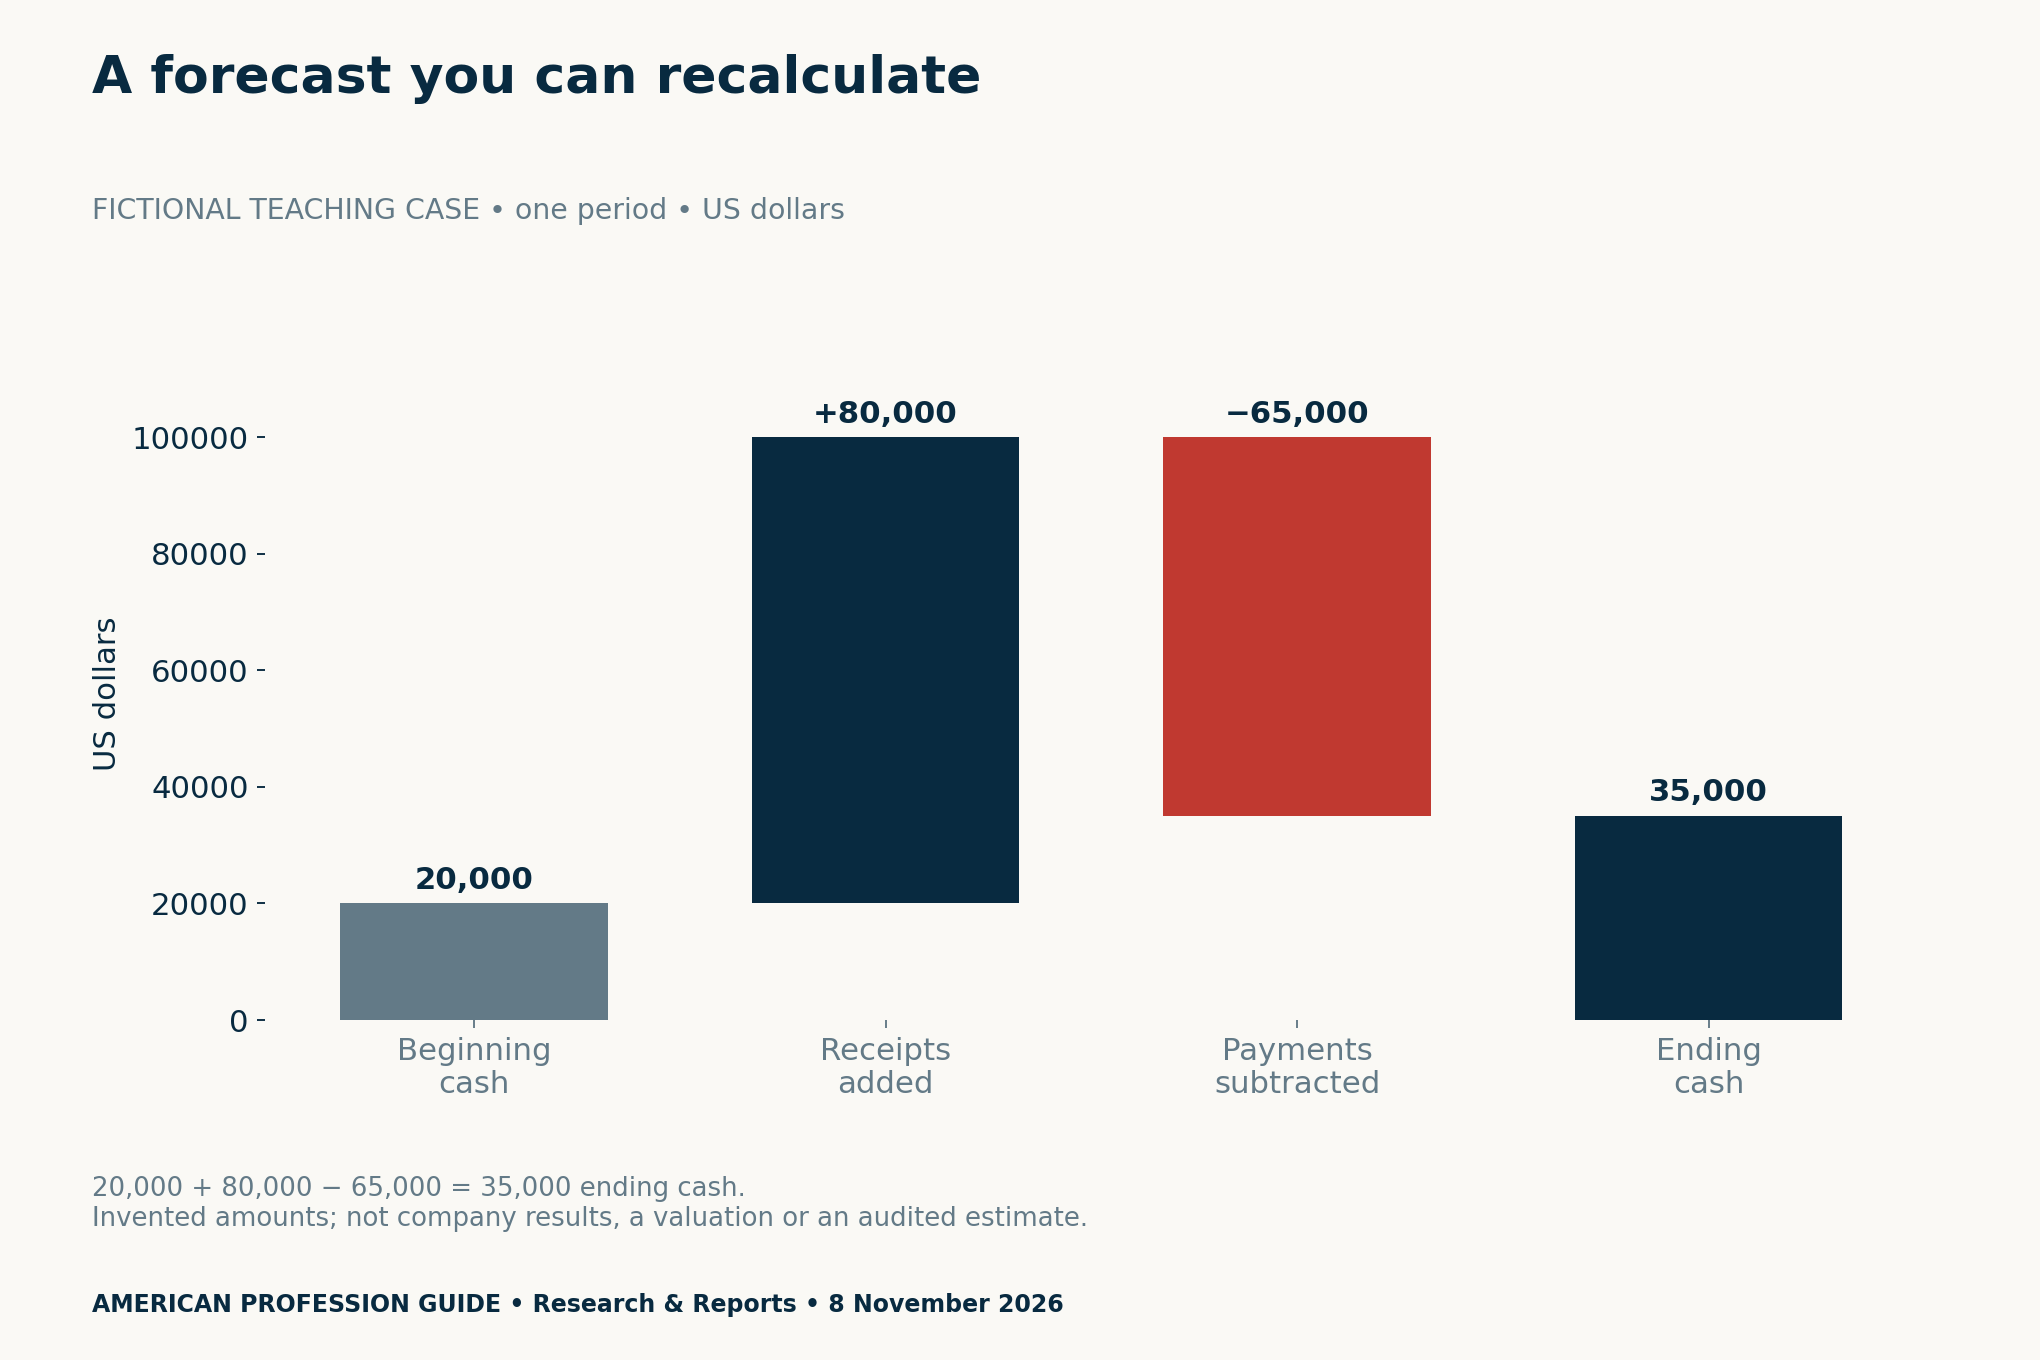
To reproduce it, type the three inputs into separate spreadsheet cells. In a fourth cell, add the first two and subtract the third. Then compare that result with the saved model output. If they differ, retain the discrepancy and investigate the inputs, signs and period before writing a conclusion.
This simple reconciliation does not validate the assumptions. A mathematically correct $80,000 receipt forecast can still be poorly supported. Explain where a real input would come from, how it would be checked and what uncertainty remains. Never substitute the fictional amount for evidence about an actual business.
Challenge one assumption, then test both together
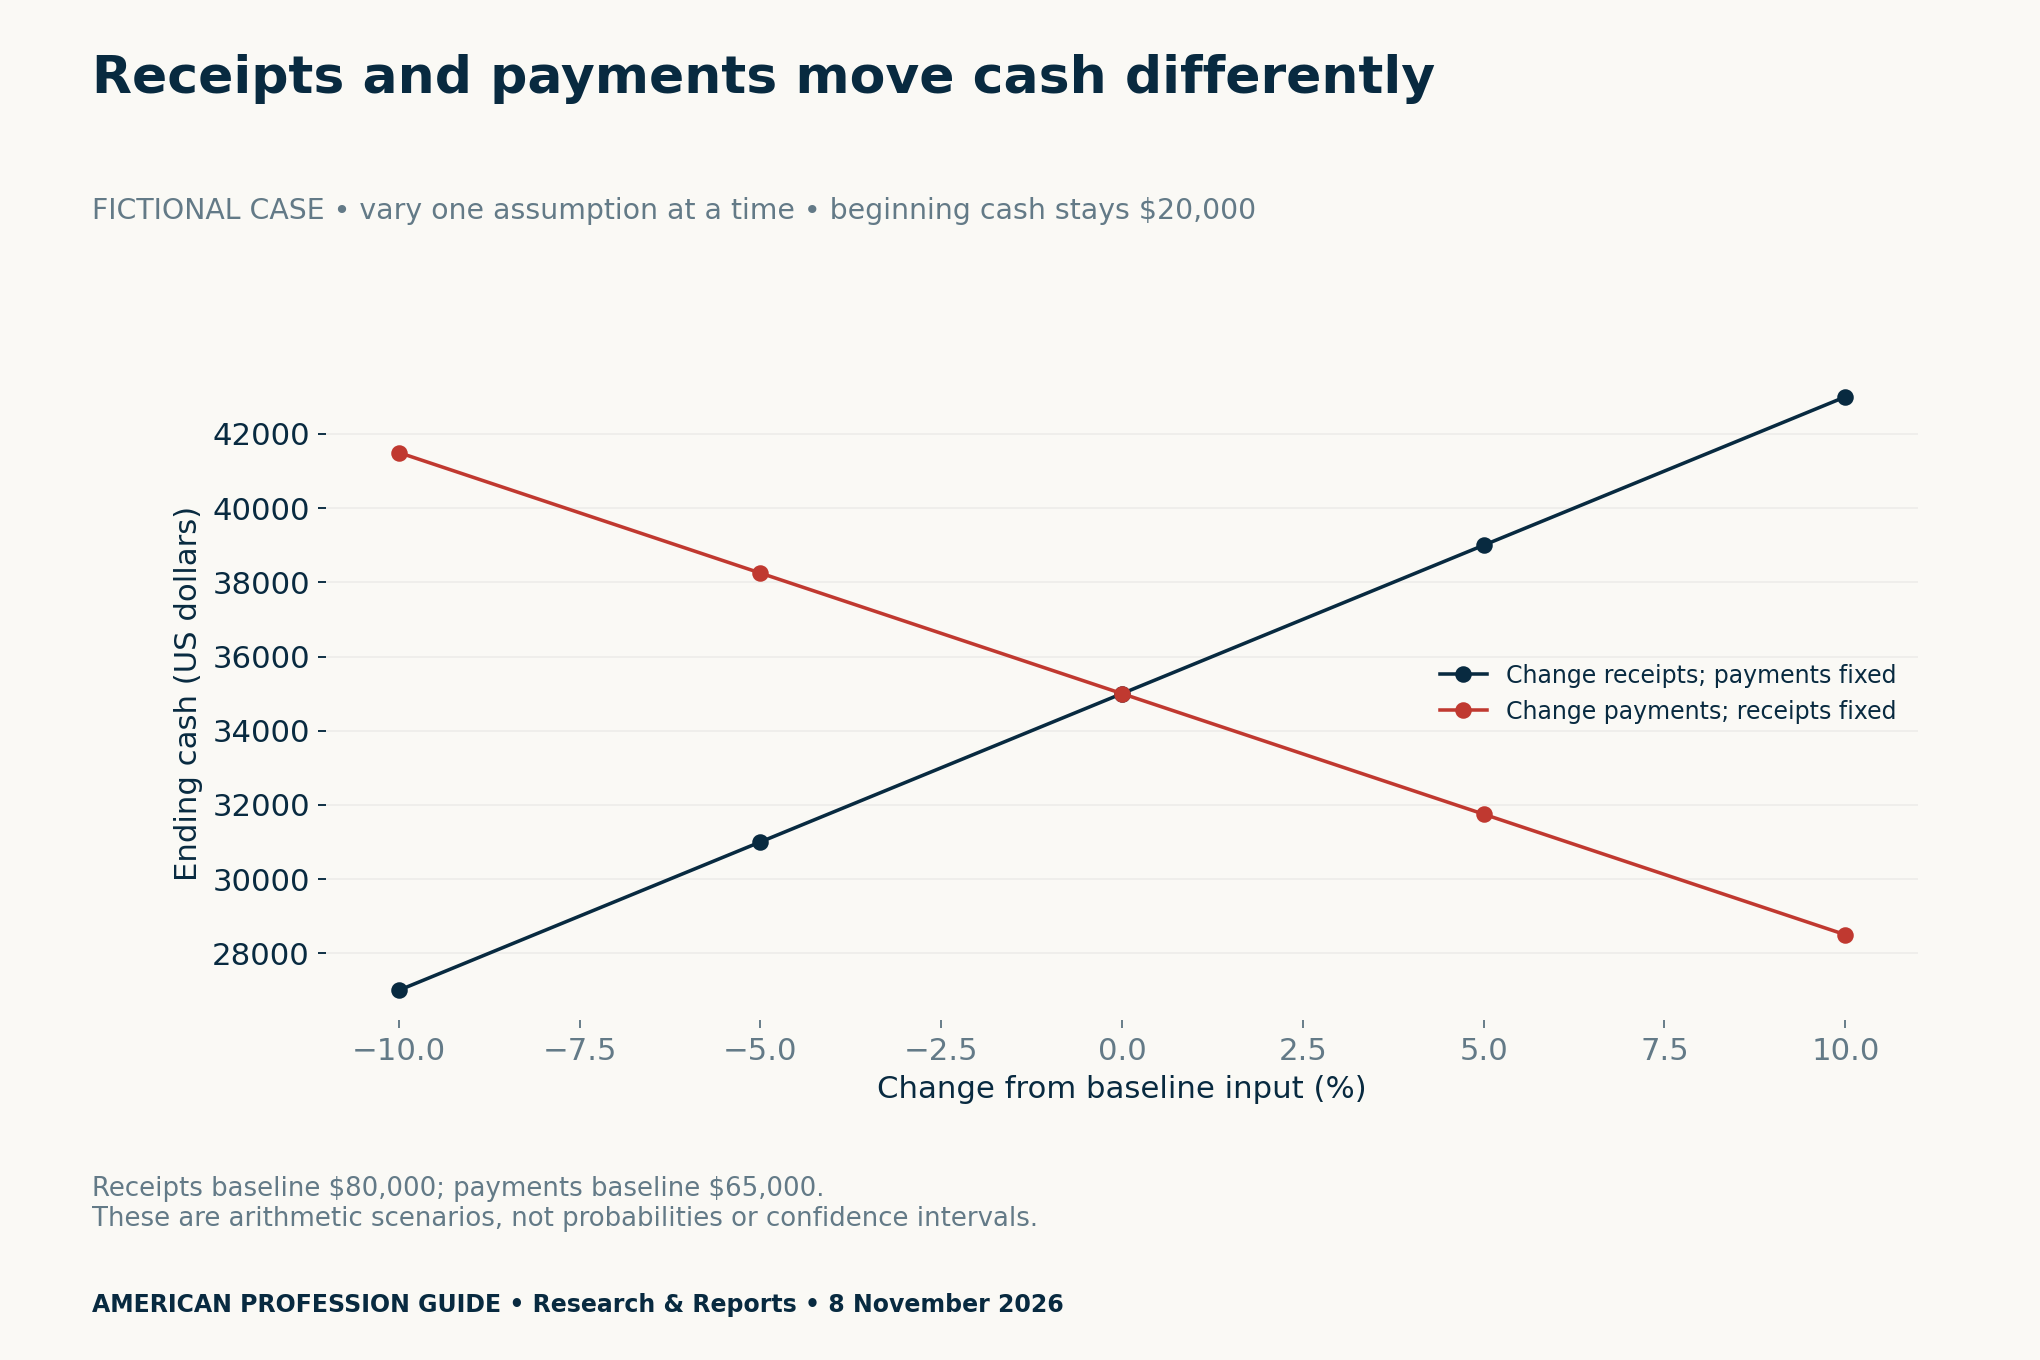
For a one-at-a-time check, change receipts by −10%, −5%, 0%, +5% and +10%, while payments stay fixed. Next, reset receipts and apply the same changes to payments. The different line directions follow directly from the formula: more receipts add cash; more payments reduce it.
A joint test answers a different question. If receipts fall 10% and payments rise 10% together, ending cash becomes $20,500. This is $14,500 below the $35,000 baseline. It is not a predicted loss, an insolvency threshold or a probability estimate.
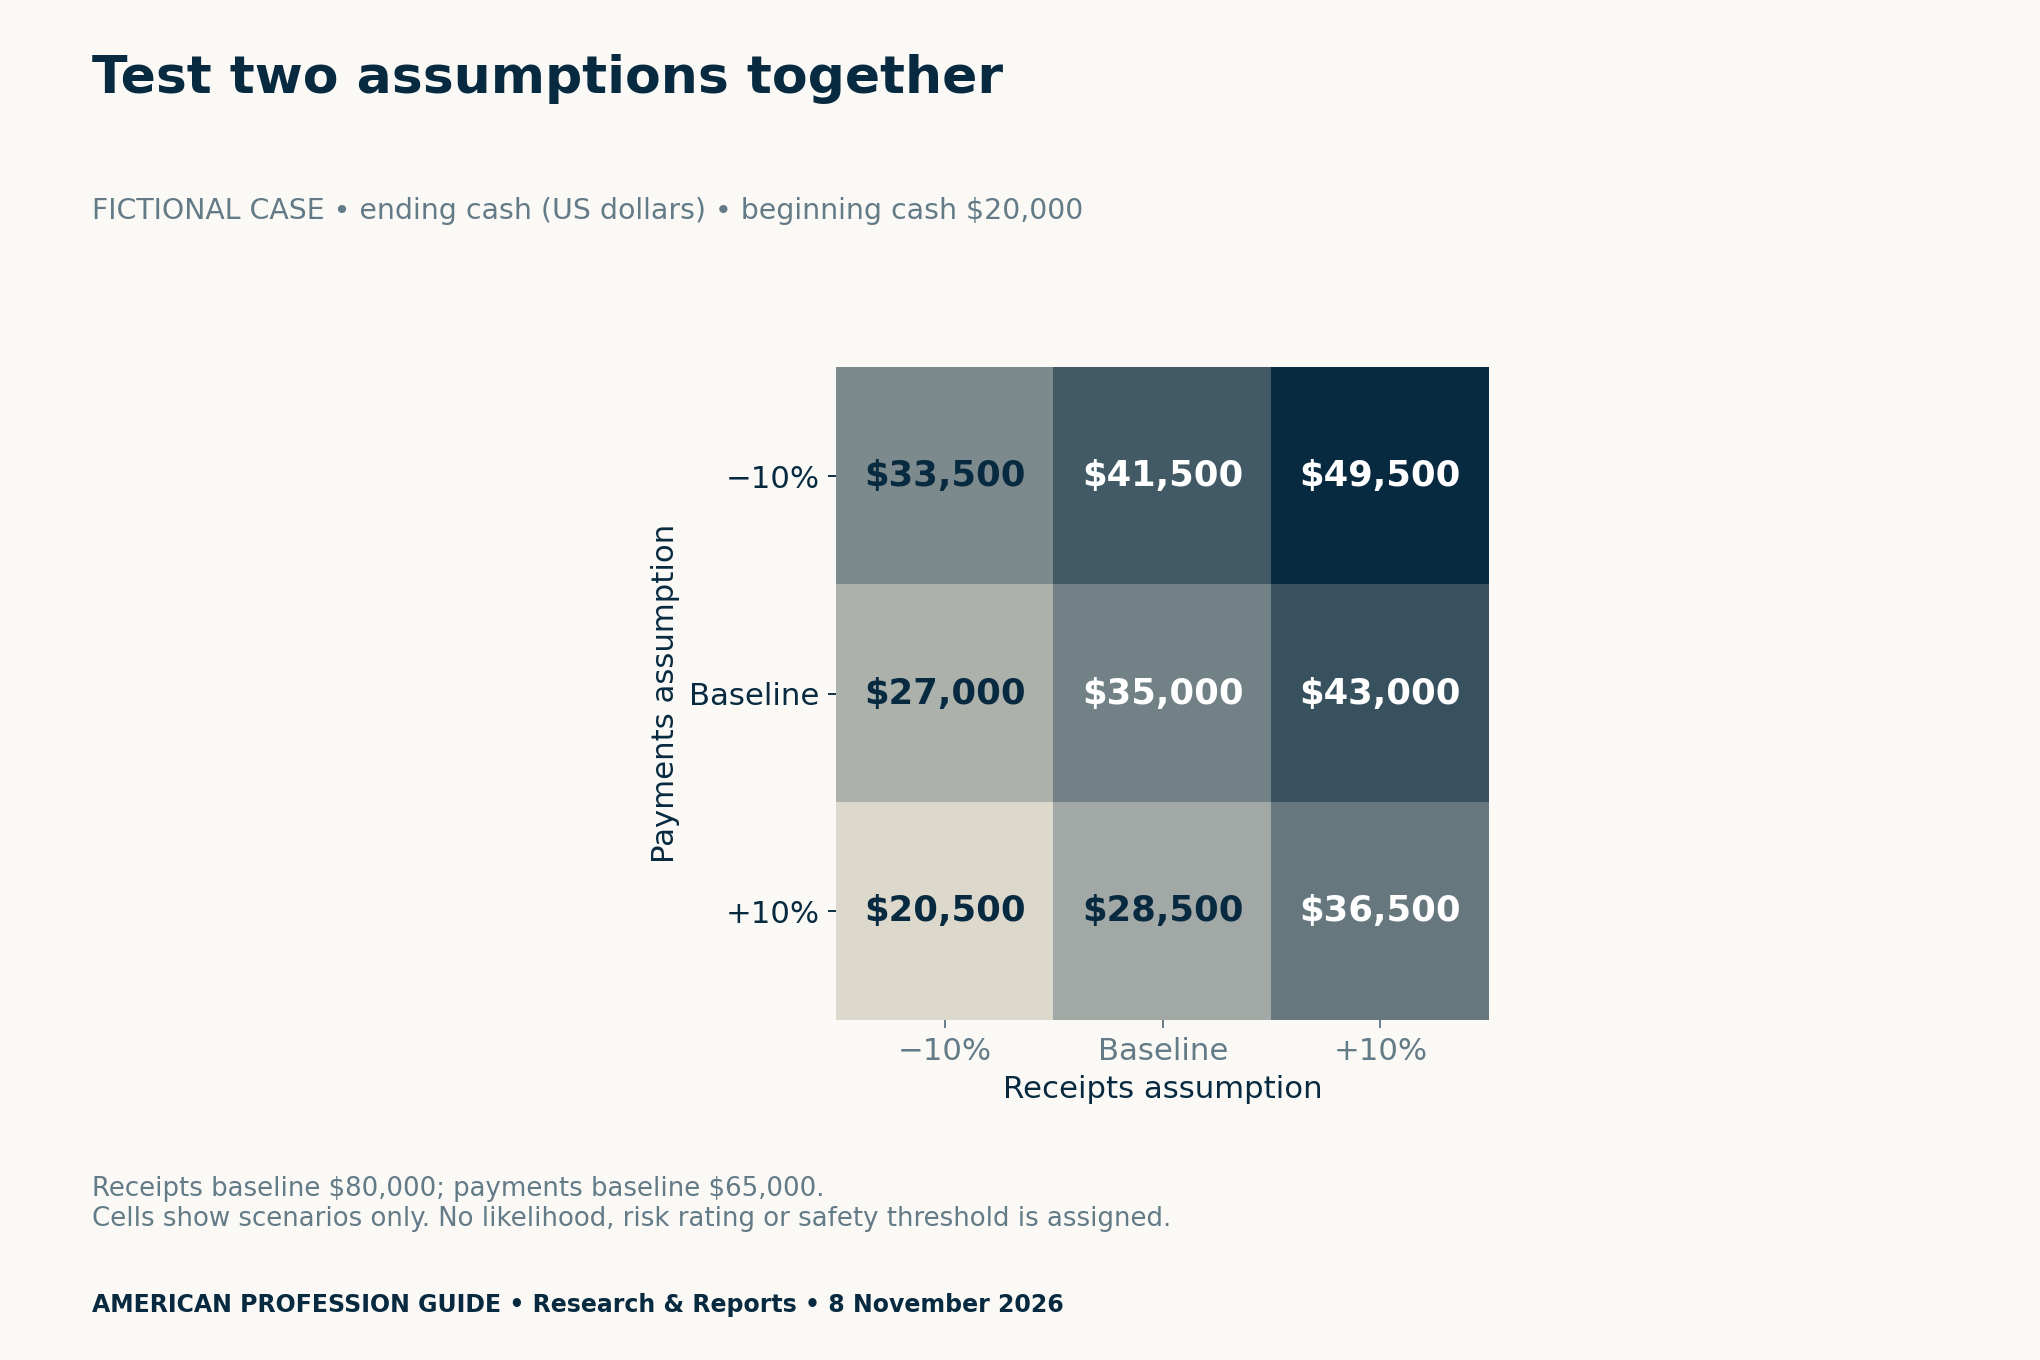
Choose a scenario range for an explained reason when adapting the exercise. The ±10% range here is an arbitrary teaching choice. It does not come from the survey. A reviewer should be able to ask why your selected range is plausible and see the evidence behind your response.
Show your judgment in a portfolio discussion
Present a short evidence note alongside the workbook. State the question, identify the invented inputs and explain what you independently checked. If an approved AI tool helped draft a description or organize assumptions, record that contribution accurately. Do not claim that this example used a proprietary model or completed a real audit.
A useful discussion follows the chain from input to conclusion. For example: “The base case gives $35,000. I checked the signs independently. The combined scenario gives $20,500, but the chosen changes are illustrative. I would need evidence about timing and uncertainty before using this in a real decision.”
Record the reviewer’s question, your response and any remaining issue. Leave the sign-off blank until a real reviewer acts. A completed checklist cannot award professional competence, satisfy every standard or predict a hiring decision. Its value is that another person can inspect your work.
For adjacent reading, see our overview of AI in IT auditing. That article concerns technology systems; this exercise concerns documenting a financial estimate. Our questions about employer AI expectations can help you clarify approved workplace practices.
Download your estimate documentation tools
- BDO source measures and methodology (CSV)
- Fictional cash-flow reconciliation (CSV)
- Fictional one-at-a-time sensitivity cases (CSV)
- Blank six-component evidence register (CSV)
The CSVs are free and require no login. They contain plain data, not spreadsheet formulas or a certified accounting model. Enter formulas yourself and keep original files unchanged when creating an adapted version. Do not add confidential client details to a shared copy.
Methodology, limits and update notes
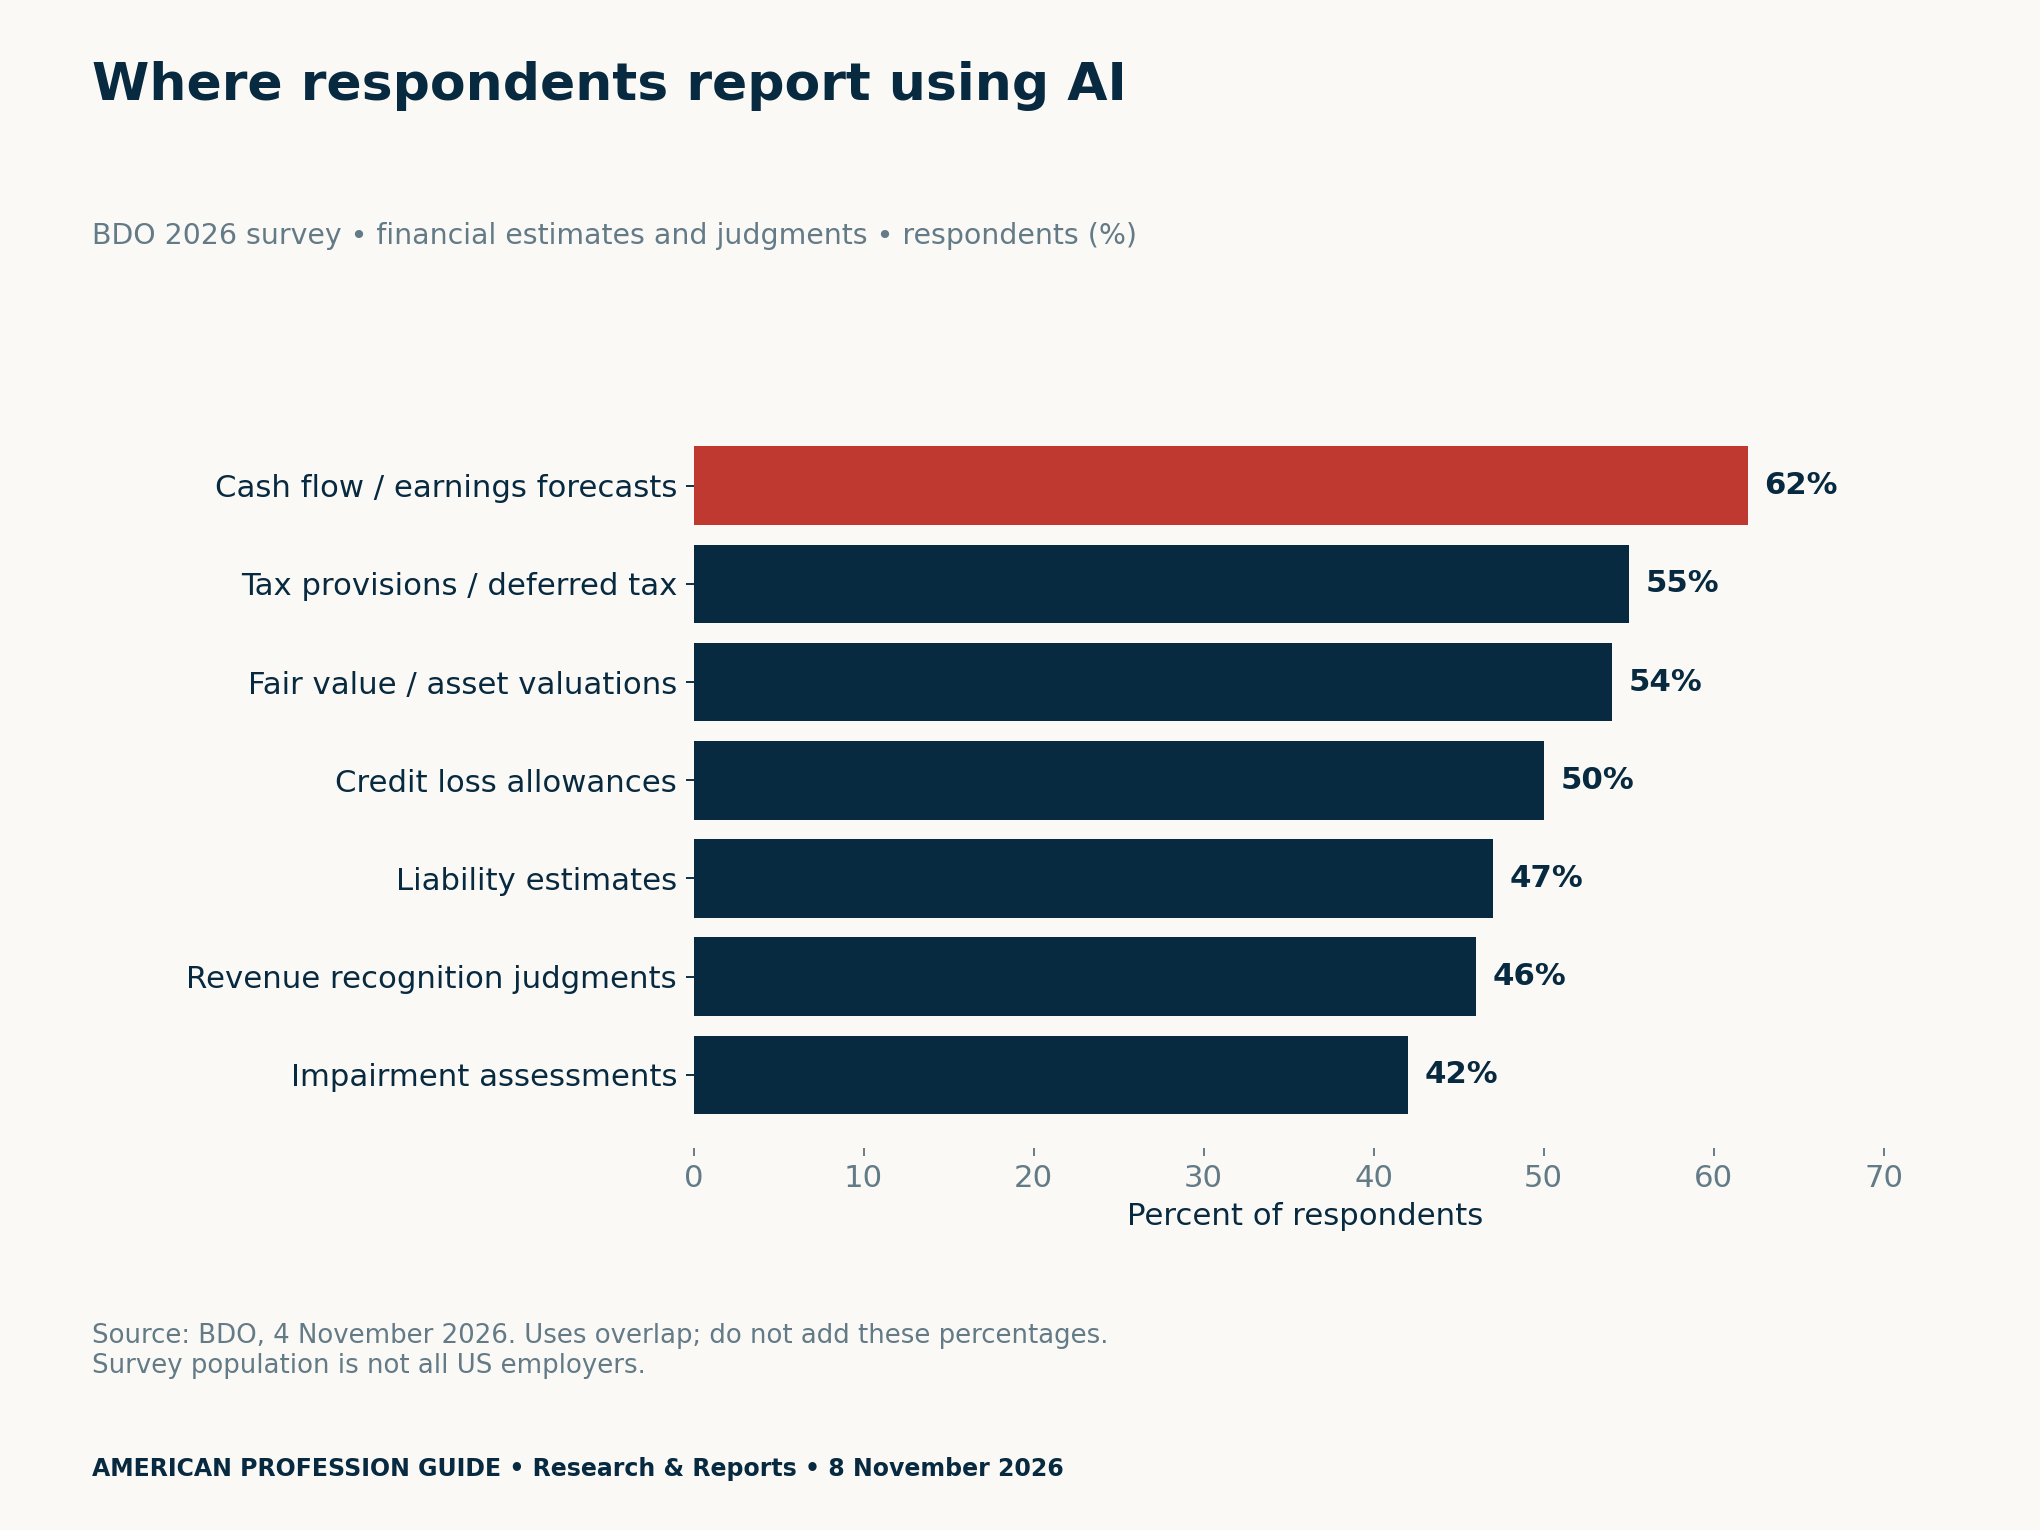
We transcribed the stated percentages and methodology from BDO’s dated release and cross-checked its public survey overview on 8 November 2026. Chart 1 compares separate questions; Chart 2 preserves overlapping application categories. We did not infer counts of individual companies, a response rate or population confidence intervals.
The remaining charts are our transparent arithmetic illustrations, with inputs and code retained separately from the survey data. The scenarios are not observed company results. No experiment, hiring analysis, salary estimate or audit-outcome test was conducted. Any technical adaptation needs appropriate practitioner review.
For updates, retain this dated snapshot and note any corrected source figures separately. If you change an input, regenerate the reconciliation and both sensitivity views together. AI accounting estimate documentation is most useful when the written explanation, figures and underlying numbers remain consistent.


