






Knowing how to read a total compensation statement starts with a simple question: who receives each kind of value, and when? Split the headline into salary, conditional pay, retirement contributions, insurance coverage, paid time and statutory employer costs. Then compare the supporting documents. A higher employer bill can coexist with a much smaller improvement in your cash position.
This guide pairs the latest verified Employment Cost Index release with an original, fictional statement exercise. The national figures describe employer costs. Every dollar in the employee example is invented. The downloadable worksheet helps you keep those two kinds of evidence separate.
What the October 2026 release actually measures
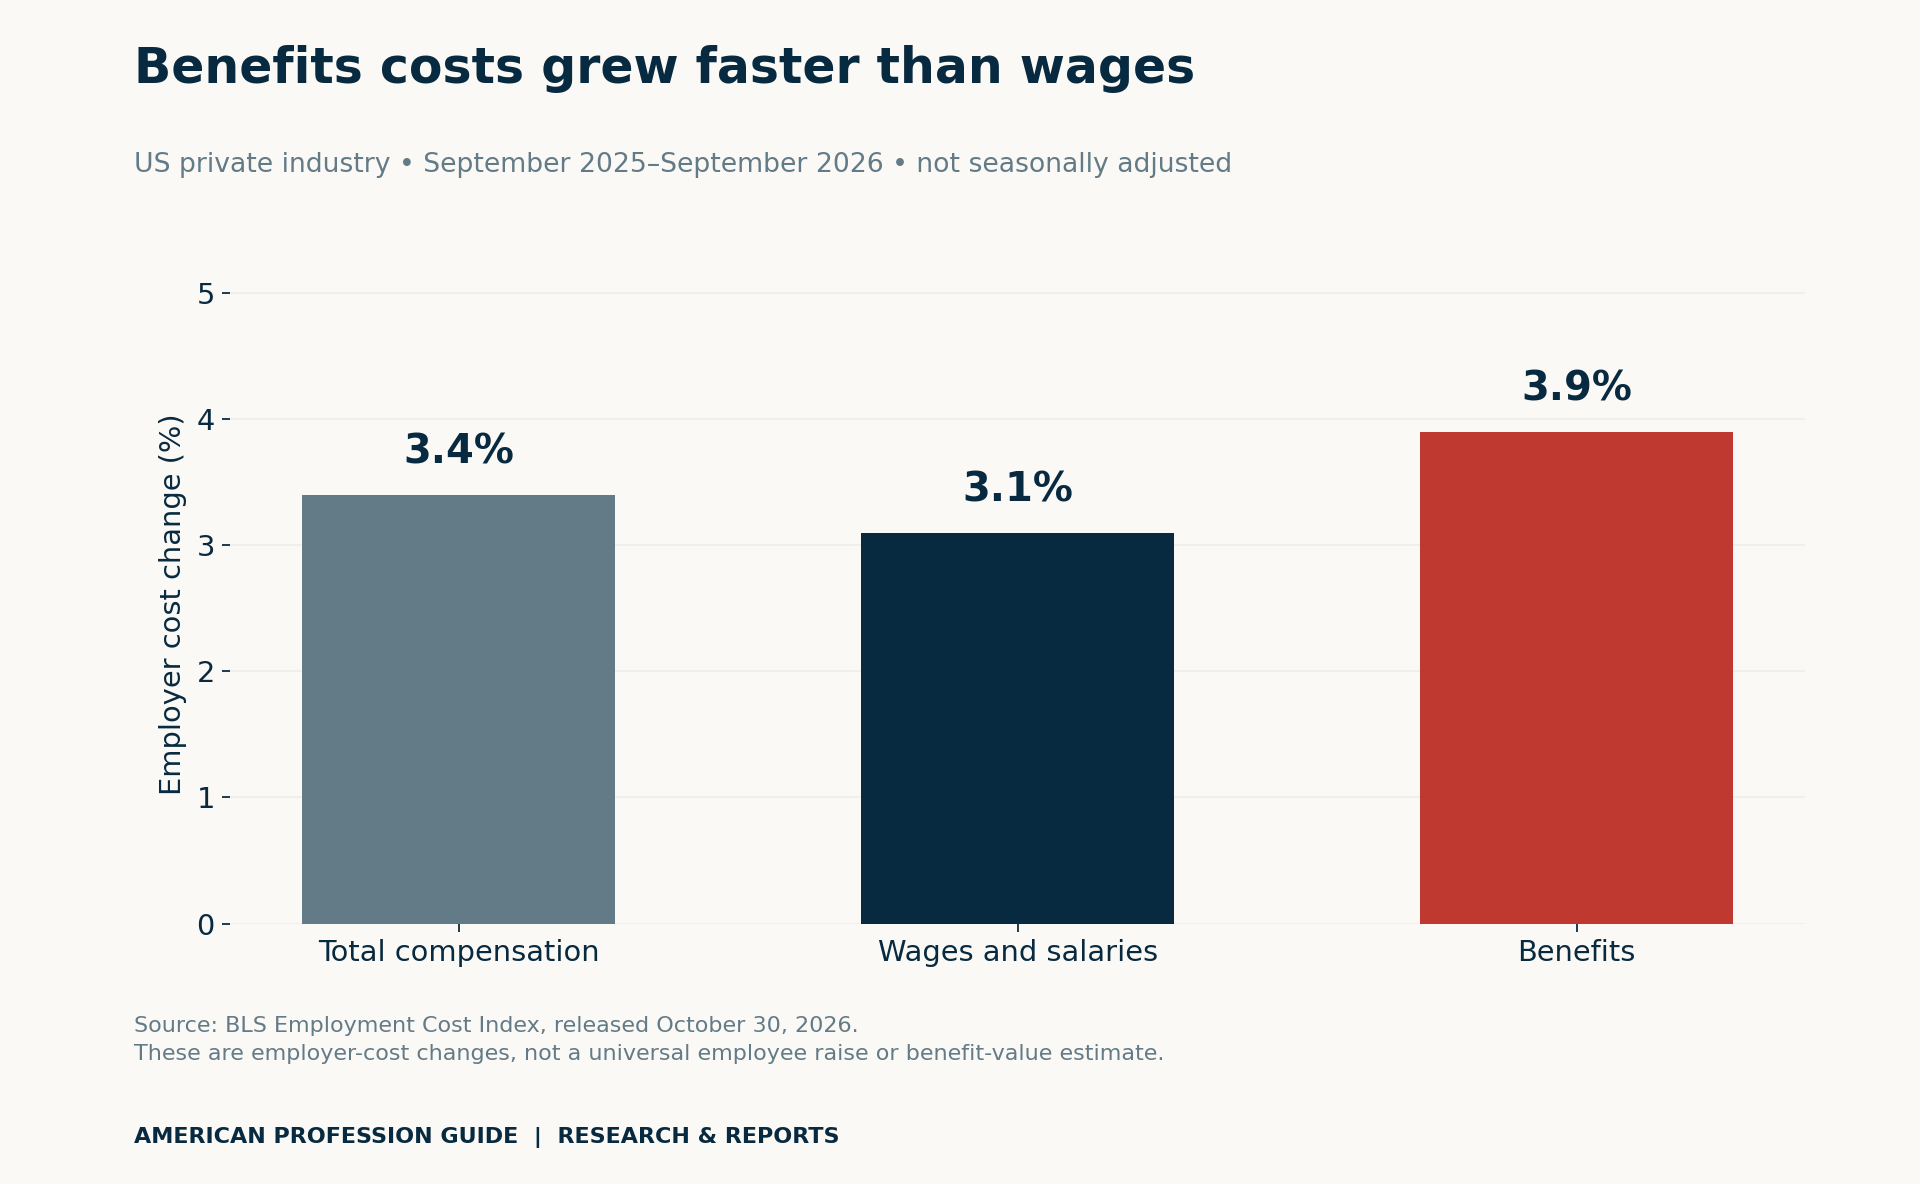
The Bureau of Labor Statistics release dated October 30, 2026 reports private-industry annual increases of 3.4% for total compensation, 3.1% for wages and salaries, and 3.9% for benefits. These cover the 12 months ending September 2026 and are not seasonally adjusted. Benefits growth exceeded wage growth by 0.8 percentage point.
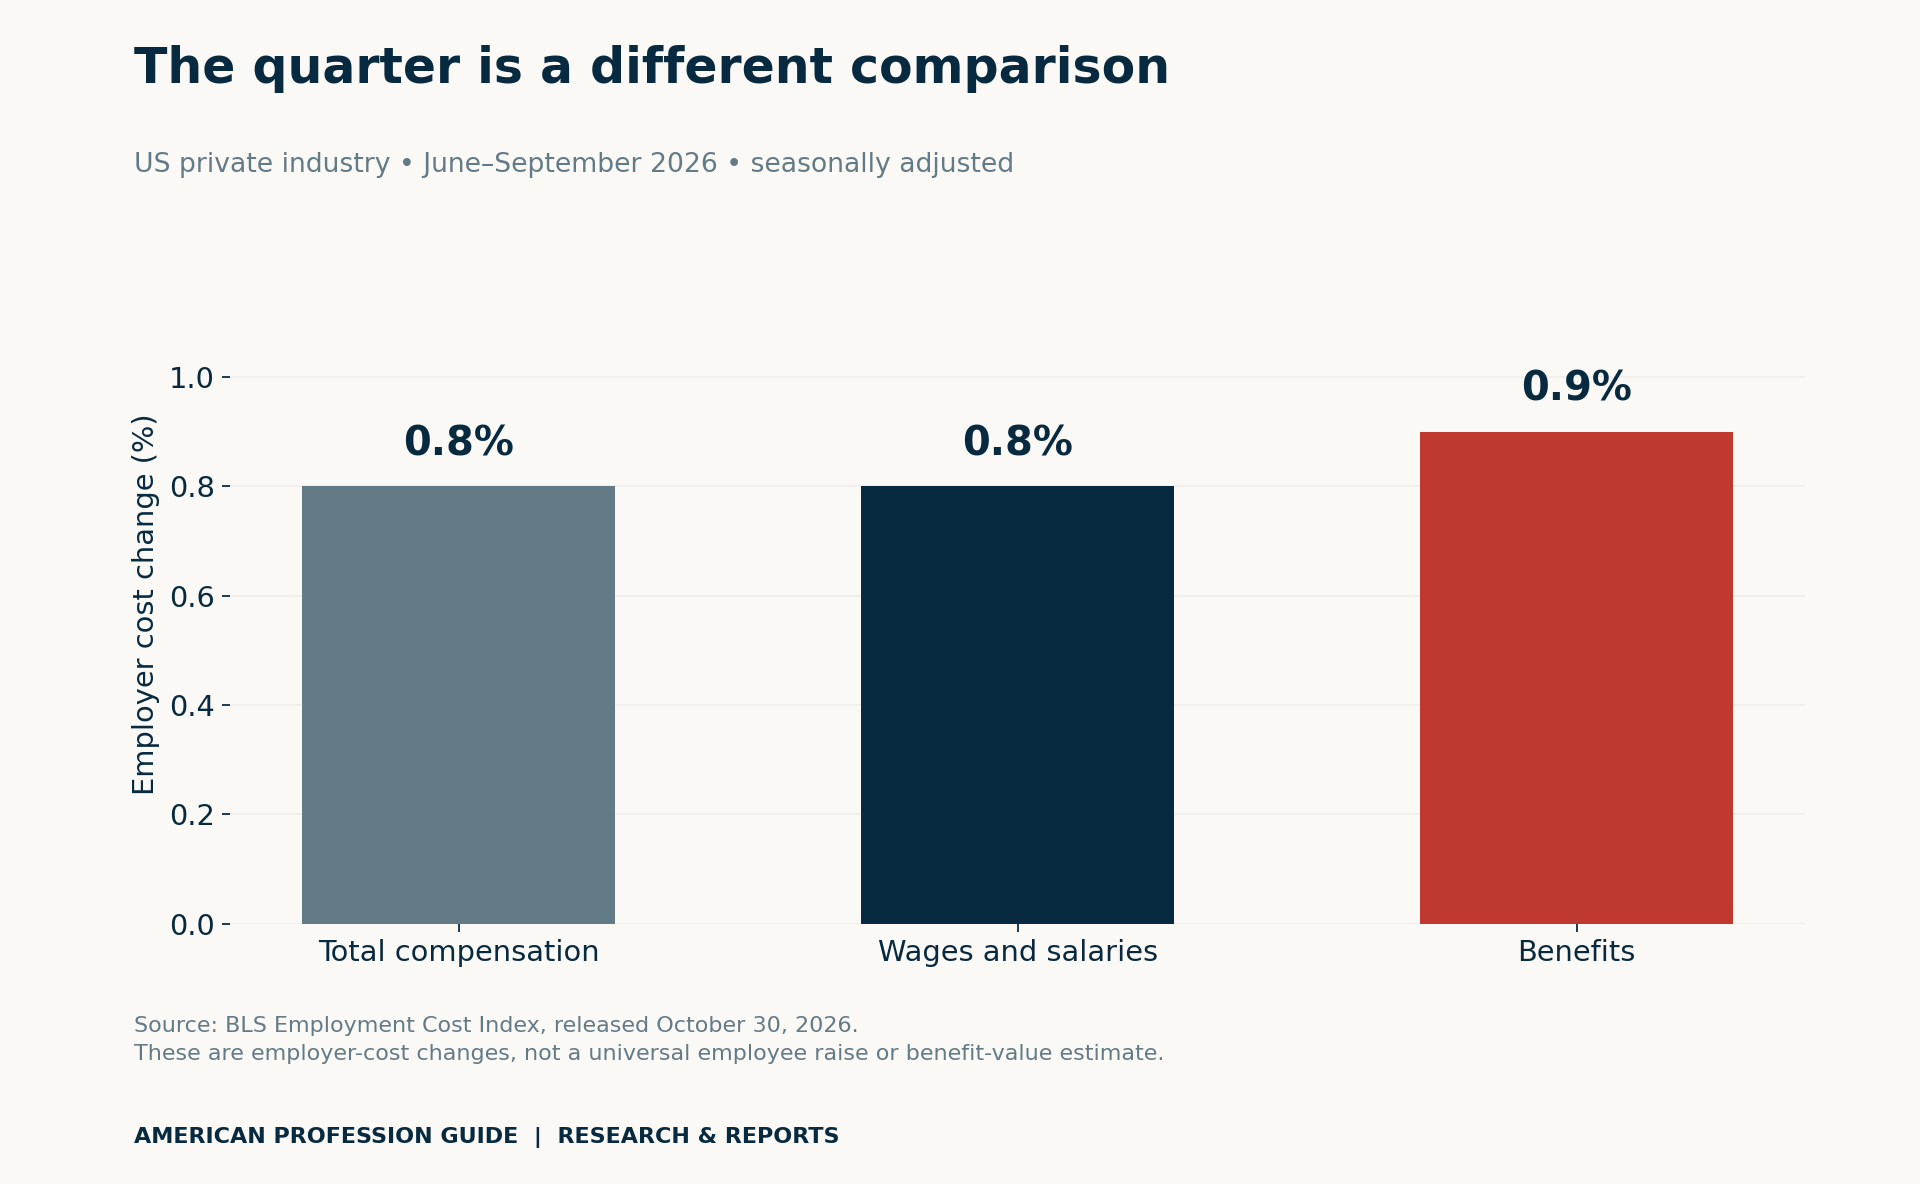
For June–September 2026, the seasonally adjusted private-industry changes were 0.8%, 0.8% and 0.9%, respectively. Keep this quarterly comparison separate from the annual one. Neither series tells you what happened to your particular salary or health-plan terms.
BLS explains in its ECI questions and answers that the index controls for shifts in industry and occupation composition. It measures changes in labor cost, rather than assigning a personal dollar value to a benefit package. Use it as context for questions, not as a verdict on an individual employer.
How to read a total compensation statement in six buckets
Start by marking each line with its type, eligibility conditions and documentary source. For example, use your salary letter for base pay and the current plan documents for benefits. If the statement mixes calendar years, plan years or full-year estimates with partial-year payments, resolve those differences before calculating growth.
| Bucket | What to establish | How to handle the figure |
|---|---|---|
| Guaranteed cash | Annual rate, effective date and hours basis | Compare like-for-like gross salary; then identify deductions separately. |
| Conditional cash | Bonus conditions, payout date and whether it was earned | Show target, earned and paid amounts separately. |
| Employer retirement contribution | Contribution formula, eligibility and vesting | Keep it separate from spendable salary; use actual plan terms. |
| Insurance coverage | Employer and employee contributions, coverage terms and period | An employer premium increase alone does not establish better coverage. |
| Paid time | Leave entitlement, salary coverage and any relevant conditions | Do not add imputed leave pay to salary that already pays for those days. |
| Statutory employer costs | What the statement includes and its valuation basis | Identify the cost without treating it as employee cash. |
A useful statement can show several totals, provided each one has a clear definition. The problem arises when a target bonus, an unvested amount and an employer expense all look equally available. Ask HR to explain ambiguous lines. Leave an unknown value blank or mark it unresolved rather than supplying a guessed amount.

Worked example: a larger statement and a smaller cash change
All inputs below are fictional. They describe two annual statements for the same imagined employee. Salary rises from $72,000 to $74,232. The employer health contribution rises from $12,000 to $15,000, while the employee health premium rises from $2,400 to $3,600. These assumed health-cost changes are not BLS findings.
| Annual line | Prior statement | Current statement |
|---|---|---|
| Guaranteed salary | $72,000 | $74,232 |
| Employer health contribution only | $12,000 | $15,000 |
| Employer retirement contribution | $3,600 | $3,711.60 |
| Illustrative statutory employer costs | $6,000 | $6,200 |
| Employer cost ledger, excluding target bonus | $93,600 | $99,143.60 |
| Conditional target bonus; not assumed paid | $5,000 | $5,000 |
| Target statement headline including that target | $98,600 | $104,143.60 |
| Employee health premium, already within gross salary | $2,400 | $3,600 |
Assume the employer retirement contributions are actually made and fully vested. The statutory-cost entries are invented ledger values, not a payroll-tax calculation. Employee health premiums come from gross salary, so adding them again to the employer ledger would double count them. Likewise, the example excludes an imputed paid-leave value because annual salary already covers that leave.
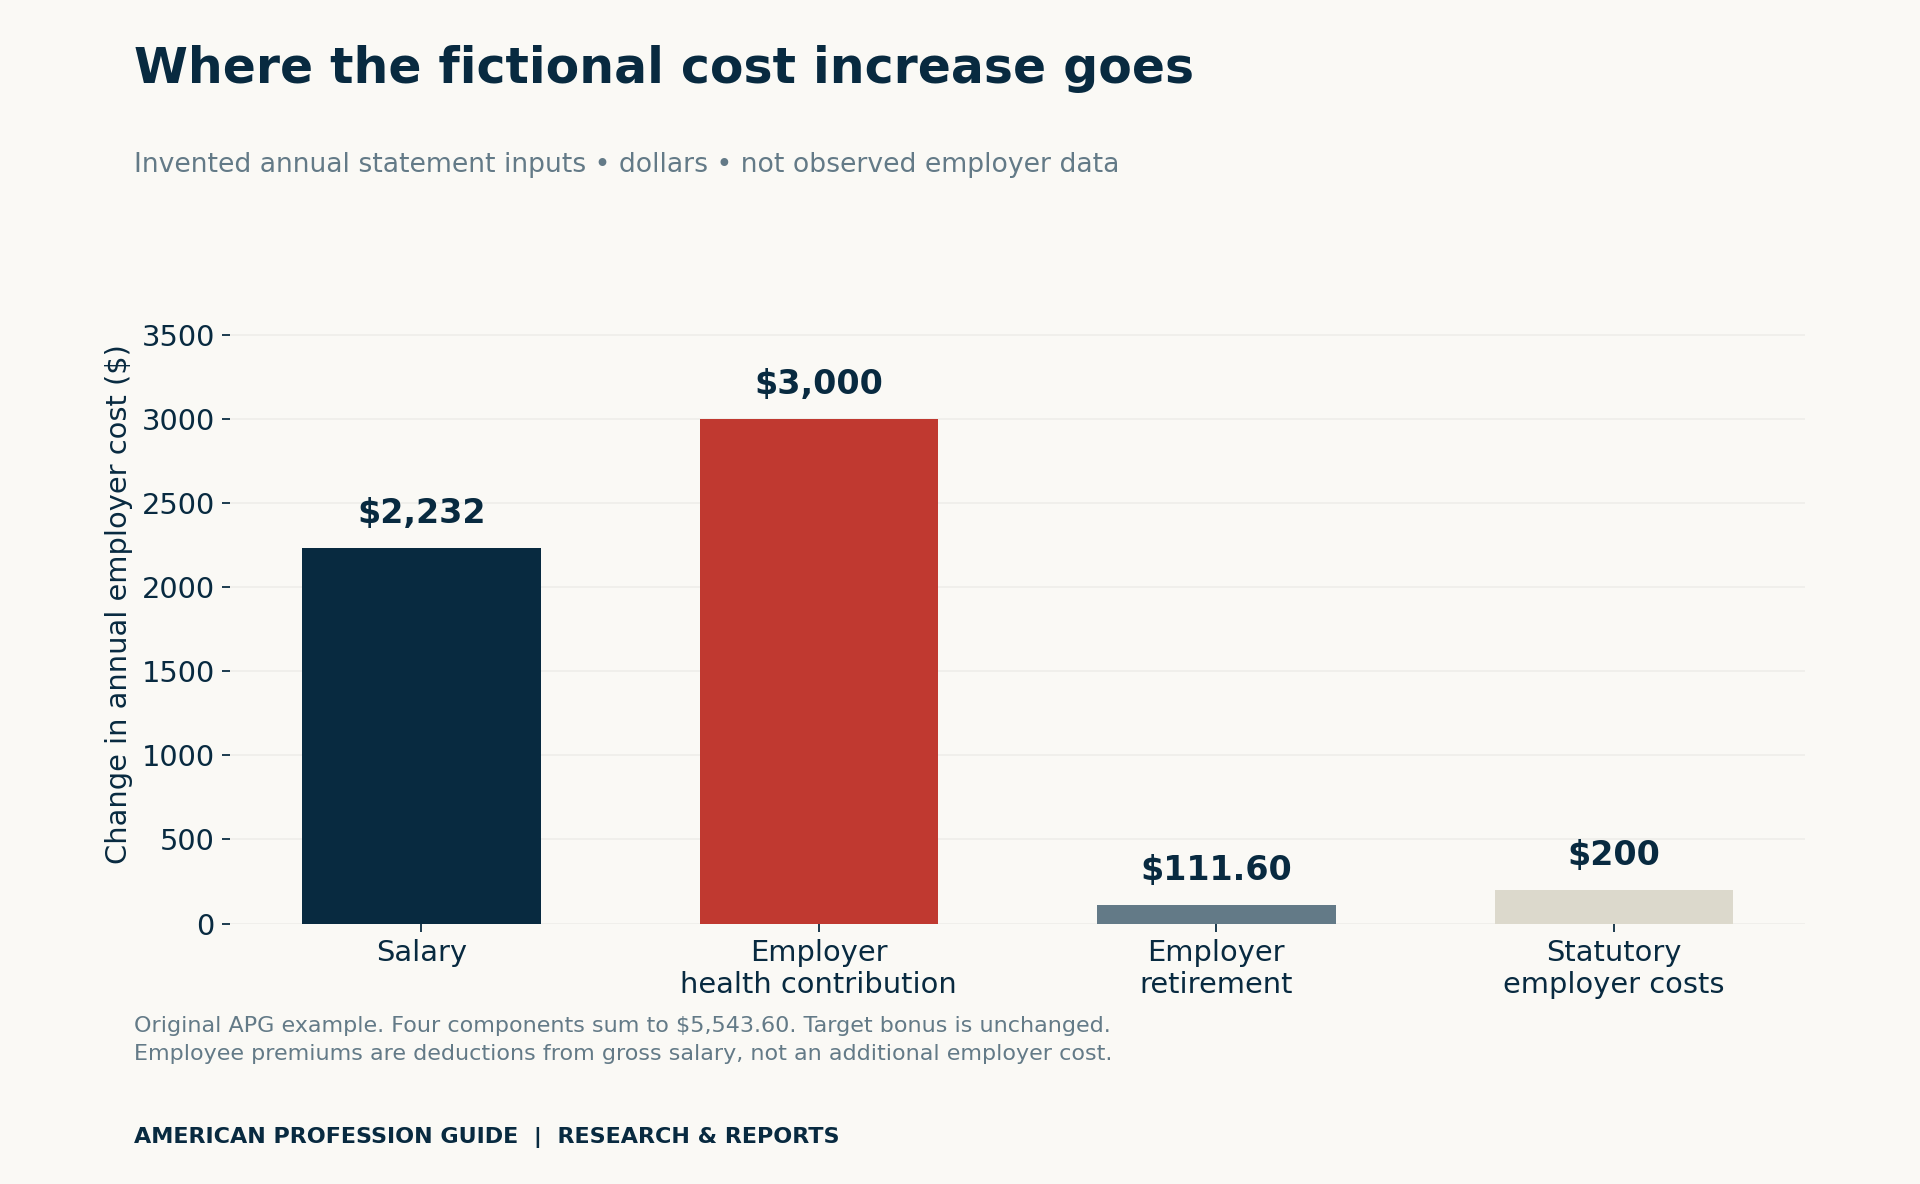
The target headline increases by $5,543.60. However, it includes a $5,000 bonus target in both years that the example does not assume is earned or paid. Most of the employer-cost increase is not additional salary. That observation does not make insurance or retirement worthless; it explains why different categories need separate comparisons.
Define the cash comparison before calling it take-home pay
Here we calculate only salary less the employee health premium. The prior amount is $72,000 − $2,400 = $69,600. The current amount is $74,232 − $3,600 = $70,632. The increase is $1,032, or 1.48% of the prior amount, after rounding.
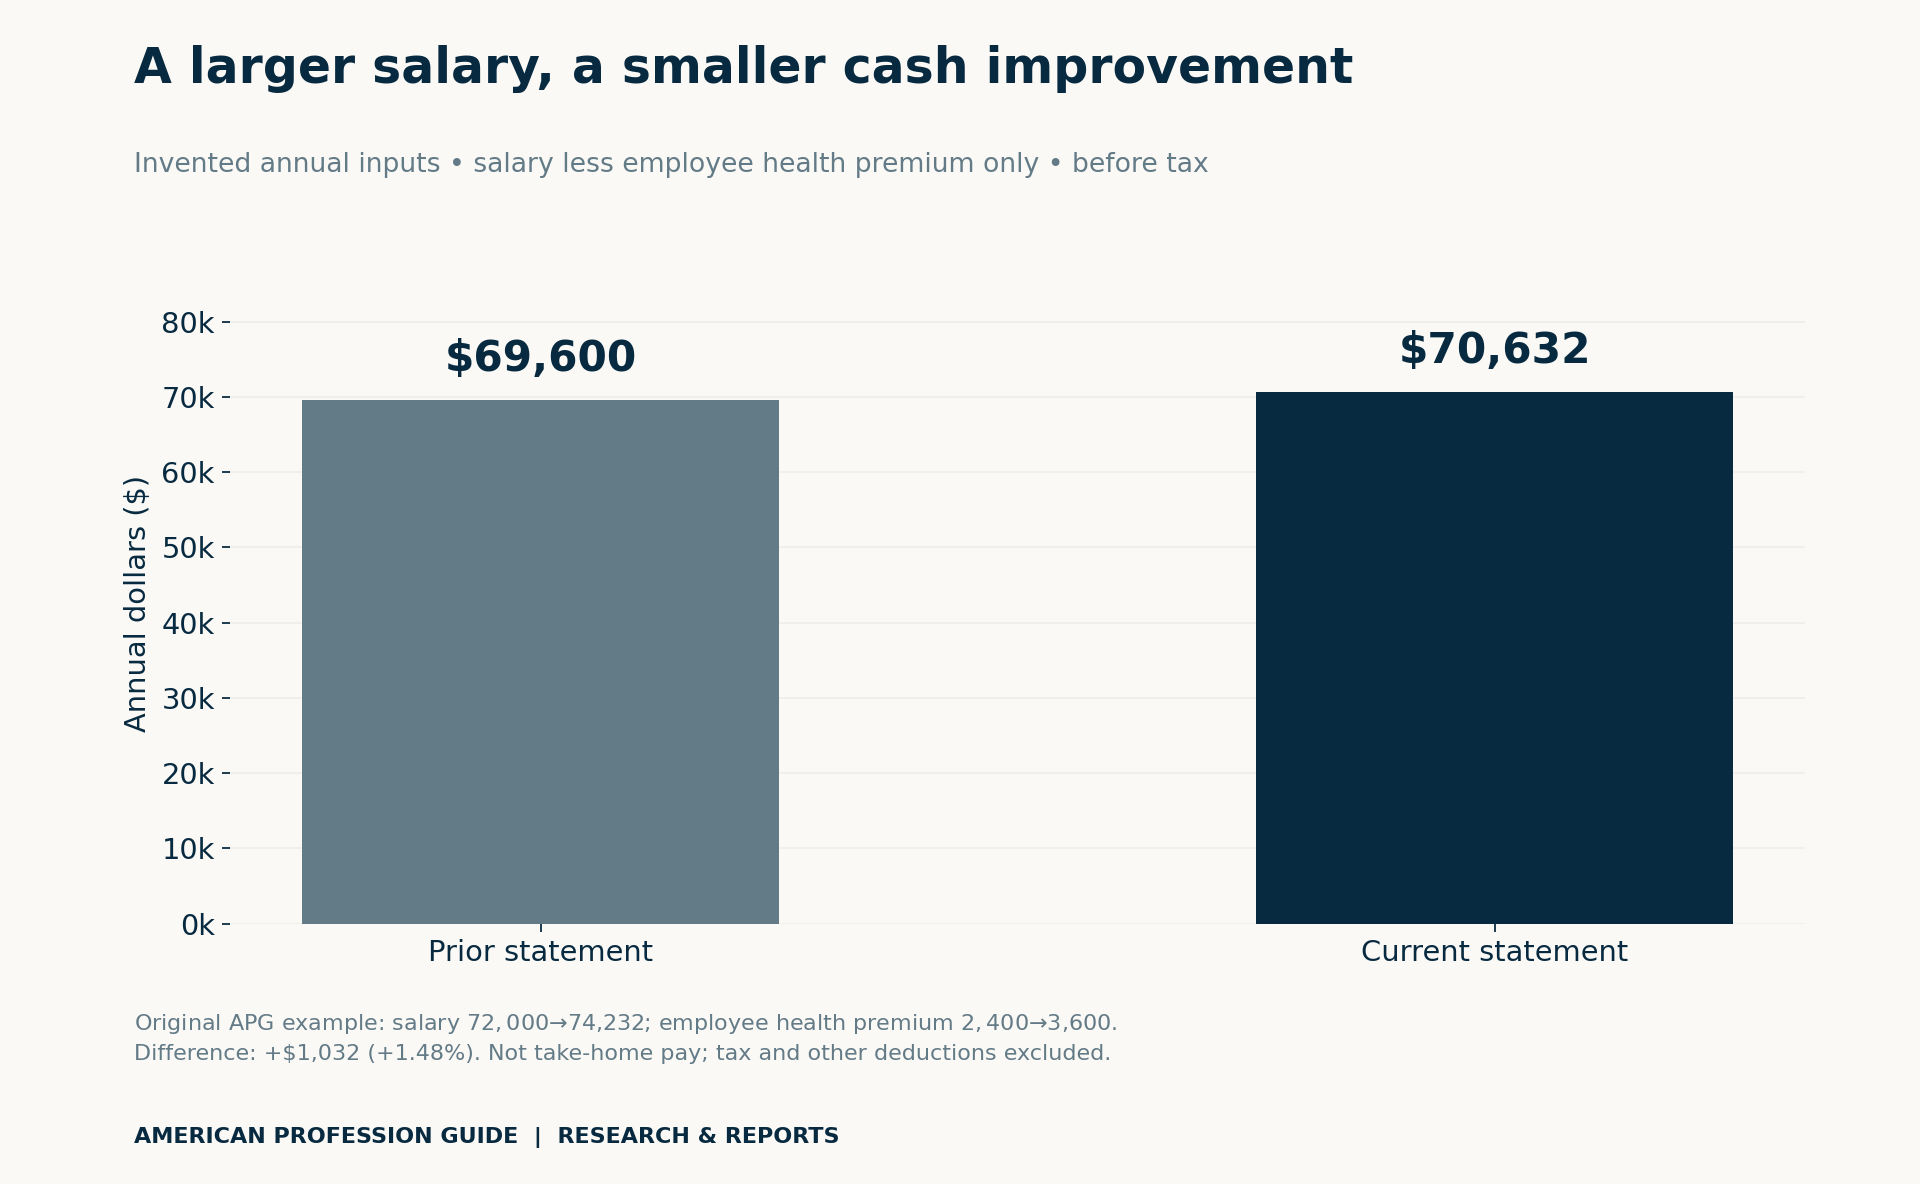
Your actual payslip may also include employee retirement deductions, other benefit elections and tax withholding. This exercise does not calculate those items. It therefore cannot establish net pay, tax treatment or the best package for your household. Use the narrow label whenever you reproduce the result.
Test how premium changes affect the result
Hold the fictional $2,232 salary increase fixed. Subtract any increase in the employee annual health premium. At an extra $600, this limited cash comparison improves by $1,632. At an extra $1,200, it improves by $1,032. An extra $2,232 absorbs the entire salary increase in this calculation.
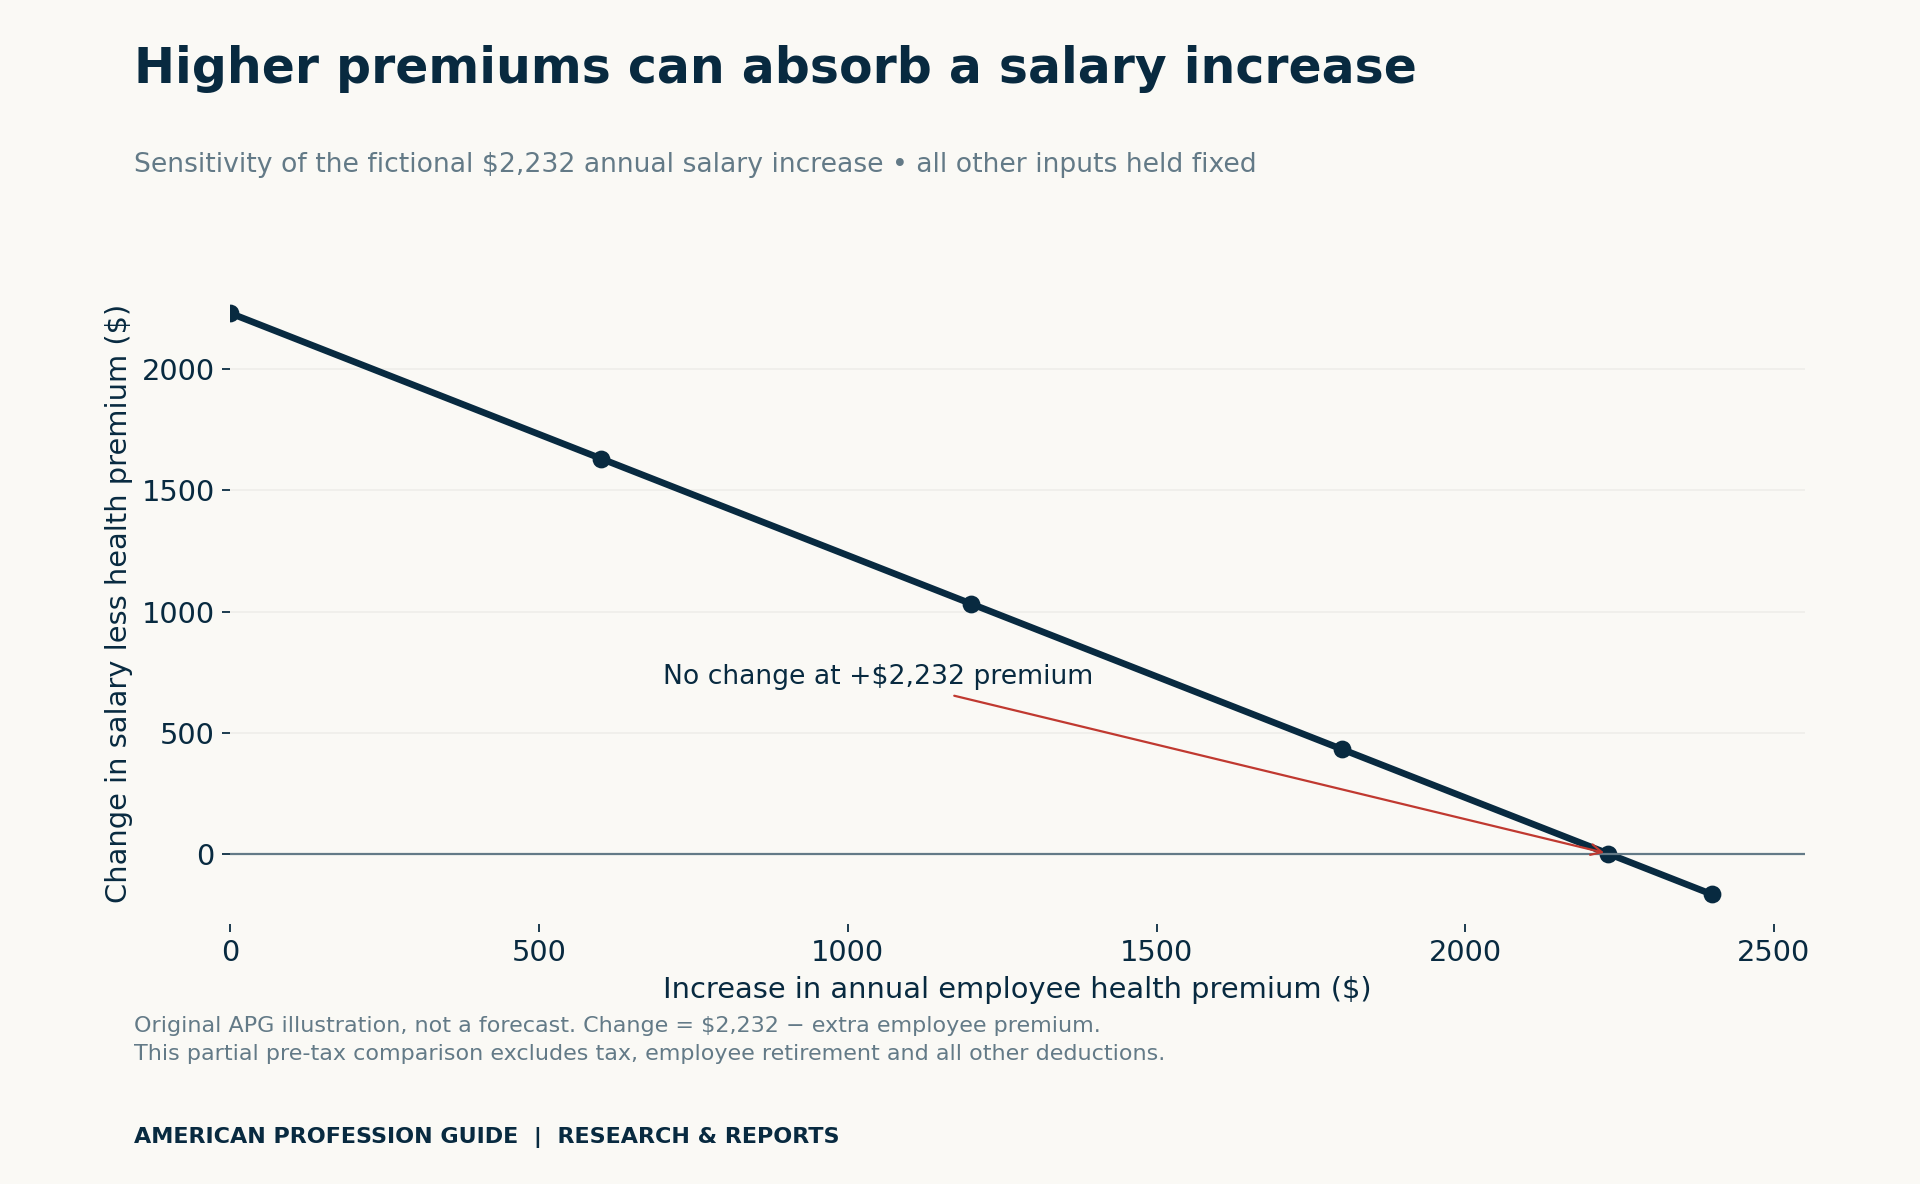
This test changes just one assumption. It says nothing about deductibles, networks, services used or the quality of coverage. Those require a separate plan comparison using current documents and your circumstances. Avoid converting an employer premium into a universal estimate of employee benefit value.
Questions to take to HR or a benefits specialist
Ask which amounts are guaranteed, which are targets and which depend on future service. Request the effective dates and the source of each valuation. Then ask whether the employer contribution excludes your own premium, whether retirement amounts are vested and whether paid leave has already been included in salary.
Next, reconcile the statement with your compensation letter, actual contribution records and relevant plan documents. Record any mismatch and who will resolve it. A written answer is more useful than silently adjusting the worksheet to force a total. Do not upload confidential personal statements to a public template or share unnecessary account details.
For a different decision, our salary purchasing-power comparison across US metros examines location costs. Keep that question separate from package reconciliation: a statement explains pay components, while purchasing power depends on what those dollars buy.
Download the data and repeat the reconciliation
The CSV files open in common spreadsheet tools. Blank cells in the worksheet mean information still needs to be obtained; they do not mean zero. Fill in comparable annual amounts, keep the employer and employee shares separate, and document conditions before summing a bucket.
Download the BLS observations and period definitions (CSV), fictional statement inputs (CSV), blank compensation reconciliation worksheet (CSV), and premium sensitivity calculations (CSV).
Methodology, limitations and suggested citation
Research checked November 3, 2026. We transcribed six private-industry ECI observations from Table A and the accompanying release: three annual and three quarterly changes. We kept their periods and adjustment status intact. The 0.8-point annual gap is 3.9 − 3.1; it is not 0.8% additional pay. No national average was assigned to an individual package.
The original exercise uses invented dollars and transparent arithmetic. Employer-ledger changes reconcile to $5,543.60; the narrow cash change reconciles to $1,032. Both scripts and retained data reproduce those results. The example does not estimate tax, insurance adequacy, future bonus payouts or pension value. Different plan rules and personal circumstances can change a real comparison.
Suggested citation: American Profession Guide, “How to Read a Total Compensation Statement,” November 3, 2026. Identify BLS as the source of national employer-cost changes, and label the dollar example as an APG fictional exercise. Reuse the worksheet with those distinctions intact.


