




System Monitoring Tools
System administrators rely on monitoring tools to assess system performance in real time.
These tools track, manage, and optimize important system metrics.
Modern IT environments use diverse technologies and increasingly complex systems.
Therefore, robust monitoring tools help ensure smooth system operation.
Criteria for Selecting System Monitoring Tools
Organizations should evaluate several factors before selecting system monitoring tools.
These factors help systems administrators choose tools that match their specific requirements.
Furthermore, careful evaluation supports effective monitoring as systems and environments change.
Scalability
Scalability determines whether a monitoring tool can support an expanding system.
The tool should handle increasing loads as the environment grows.
Therefore, administrators should select tools that remain effective as monitoring needs evolve.
Ease of Use
Administrators should choose monitoring tools with user-friendly and intuitive interfaces.
Clear controls make alerts and notifications easier to configure and manage.
As a result, simple tools save time and reduce configuration errors.
Monitoring Capabilities
Monitoring capabilities determine which system metrics a tool can track.
Administrators should examine whether the tool provides real-time performance insights.
Comprehensive features help administrators monitor all important aspects of their systems.
Integration with Other Tools
A monitoring tool should integrate easily with existing tools and systems.
This integration can streamline monitoring processes and consolidate data in one location.
Additionally, administrators should review compatibility with monitoring, logging, and alerting platforms.
Cost
Cost remains an important consideration when administrators select monitoring tools.
Administrators should compare each tool’s price with its features and benefits.
Consequently, the selected tool should fit the budget while meeting monitoring requirements.
Tools for Different Systems and Environments
Different systems and environments may require different monitoring tools.
For example, cloud-based systems may need tools designed for cloud infrastructure.
Meanwhile, traditional on-premise environments may benefit from different monitoring capabilities.
Administrators should evaluate their specific requirements before selecting suitable tools.
They should also confirm that each tool supports their unique systems and environments.
Ultimately, careful comparison helps organizations align monitoring tools with their needs and goals.
Top System Monitoring Tools for Network Monitoring
Network monitoring tools help systems administrators maintain reliable and efficient infrastructure.
These platforms provide visibility into devices, services, applications, and network performance.
Nagios, SolarWinds, and Zabbix offer different approaches to monitoring network environments.
- Nagios: Nagios provides open-source monitoring for servers, switches, applications, and services.
- SolarWinds: SolarWinds offers centralized monitoring with comprehensive features and a user-friendly interface.
- Zabbix: Zabbix supports monitoring for servers, virtual machines, and network devices.
Nagios delivers real-time monitoring across network devices and services.
Administrators can configure alerts and notifications for critical issues.
Flexible reporting supports detailed network performance analysis.
Consequently, Nagios helps administrators identify issues before they affect users.
SolarWinds simplifies setup through automated network discovery.
Customizable dashboards display important network performance metrics.
Advanced alerts and reports support timely notifications and troubleshooting.
As a result, SolarWinds helps administrators improve network reliability.
Zabbix scales to support complex and diverse network environments.
Transform Your Career Today
Unlock a personalized career strategy that drives real results. Get tailored advice and a roadmap designed just for you.
Start NowIts agentless monitoring approach can simplify deployment and management.
Zabbix supports multiple data collection methods for broader monitoring coverage.
Built-in alerts and reports support proactive issue resolution.
Proactive Network Issue Management Through Monitoring
Monitoring tools help administrators detect network issues before disruptions become severe.
Real-time visibility allows administrators to track critical metrics continuously.
Alerting capabilities notify teams when network problems occur.
Therefore, administrators can respond quickly and begin resolving issues.
Reporting features help teams analyze network data and identify performance trends.
- Real-time monitoring provides continuous visibility into network performance.
- Alerts and notifications help administrators respond quickly to network issues.
- Reports support informed decisions that can optimize network performance.
By using these capabilities, administrators can support smooth network operations.
They can also help deliver a consistent experience for end users.
Discover More: Cloud Engineering vs. DevOps: Key Differences
Server Monitoring Tools
Server monitoring tools give administrators practical ways to examine servers, applications, databases, and logs.
This section examines ManageEngine Applications Manager, PRTG Network Monitor, and Datadog.
Each platform supports different views of system performance and application health.
ManageEngine Applications Manager
- ManageEngine Applications Manager monitors servers, applications, and databases through one comprehensive platform.
- It shows resource use, server performance, and application health in real time.
- Custom alerts and automated remediation actions help administrators address issues before they affect users.
PRTG Network Monitor
- PRTG Network Monitor tracks server performance, bandwidth usage, and network traffic.
- It helps administrators locate bottlenecks, troubleshoot issues, and improve server performance.
- An intuitive dashboard and customizable reports show health and performance trends over time.
Datadog
- Datadog provides cloud-based monitoring for servers, applications, and logs.
- AI-powered alerts and anomaly detection help administrators identify performance issues quickly.
- Correlating server metrics with application data gives administrators a broader view of system health.
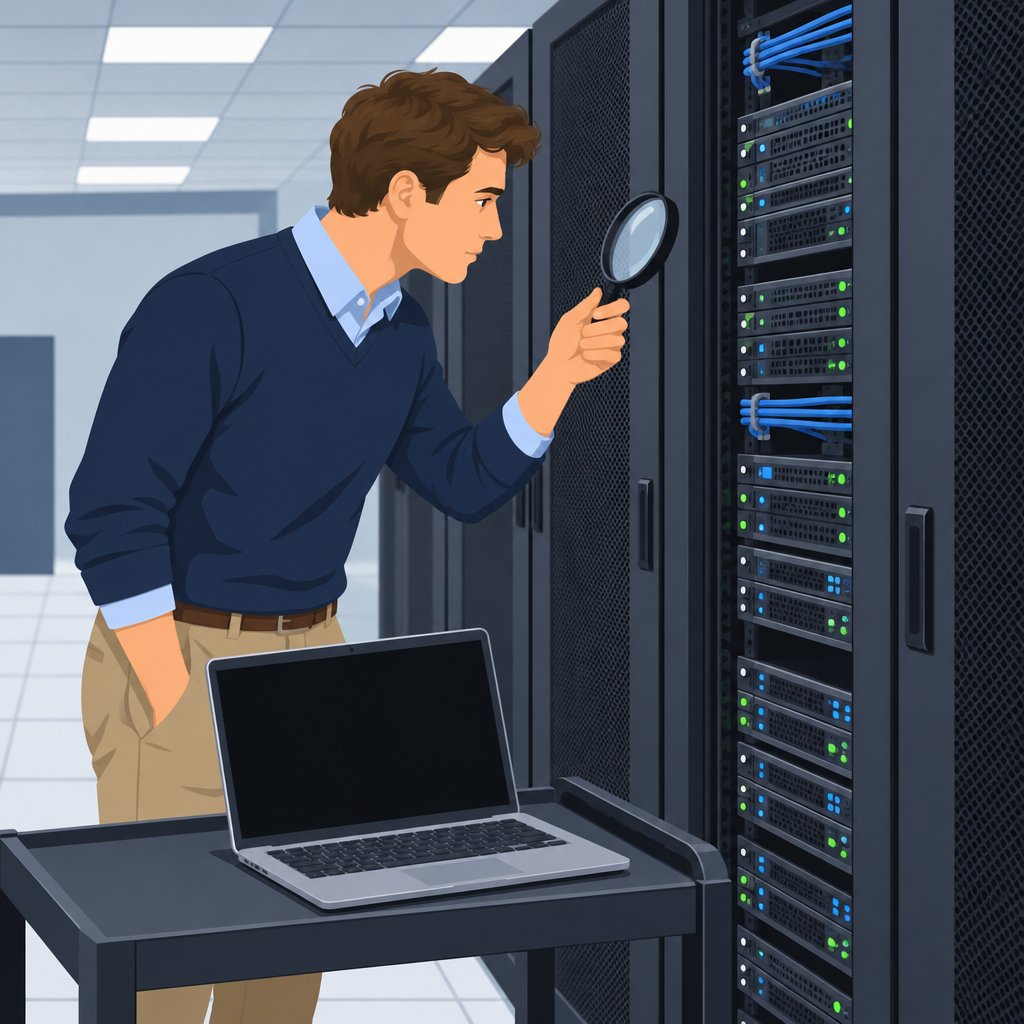
Importance of Server Monitoring
Server monitoring supports reliable system performance and availability.
Administrators can detect resource, performance, and application issues before they cause downtime.
These tools support informed decisions, efficient infrastructure, business continuity, and consistent user experiences.
Find Out More: IT Strategy Consulting: Pros and Cons
Top System Monitoring Tools for Application Monitoring
Application monitoring tools help administrators evaluate performance, user experience, and transaction activity.
These platforms provide visibility across applications and help teams identify performance concerns.
Dynatrace, New Relic, and AppDynamics are notable options for application monitoring.
Dynatrace
Dynatrace provides real-time insights into application performance.
Additionally, the platform identifies problems automatically and supports root cause analysis.
Its AI-powered monitoring detects anomalies and performance bottlenecks proactively.
- Dynatrace helps administrators examine application performance as conditions change.
- The platform supports faster investigation through automated problem identification.
- Its monitoring capabilities help administrators recognize potential bottlenecks early.
New Relic
New Relic provides end-to-end visibility into application performance and user experience.
Furthermore, it combines real user monitoring, synthetic monitoring, and server monitoring.
Detailed transaction traces help administrators examine performance bottlenecks at a granular level.
- New Relic shows how applications perform across different monitoring views.
- Real user monitoring helps administrators assess user sessions and interactions.
- Transaction traces reveal detailed application performance information.
AppDynamics
AppDynamics provides application performance management capabilities and insights into user interactions.
Moreover, it displays application dependencies and performance metrics.
Business transaction monitoring helps administrators assess important transactions and their user experience effects.
- AppDynamics helps administrators examine application behavior and performance.
- Dependency views clarify relationships between application components.
- Business transaction monitoring connects transaction activity with user experience.
Application Performance Monitoring Capabilities
These tools help administrators manage application performance through several monitoring capabilities.
They also support proactive analysis of application behavior and user activity.
Consequently, administrators can investigate performance conditions with greater detail.
Monitoring Application Performance
Real-time performance metrics help administrators observe applications proactively.
Detailed reports and dashboards make key performance indicators easier to track.
Alerts and notifications identify performance degradation or anomalies as they occur.
- Administrators can review application performance metrics in real time.
- Dashboards organize performance information for easier review.
- Alerts notify administrators about changing performance conditions.
User Experience Monitoring
User interaction monitoring helps administrators understand application experiences.
In addition, session and behavior data can reveal opportunities for improvement.
Real user monitoring allows administrators to evaluate actual application usage.
- Administrators can examine user interactions across application sessions.
- Behavior data helps identify areas requiring attention.
- Real user monitoring supports user experience improvements.
Transaction Tracing
Transaction tracing follows activity across the application stack.
Transform Your Career Today
Unlock a personalized career strategy that drives real results. Get tailored advice and a roadmap designed just for you.
Start NowAdministrators can examine dependencies, response times, and transaction performance.
Therefore, detailed traces help teams locate transaction bottlenecks.
- Transaction traces show activity across application components.
- Response time analysis highlights slower transaction processing.
- Dependency analysis supports more focused performance optimization.
Application Monitoring for Performance Issue Resolution
Application monitoring helps administrators identify and resolve performance issues effectively.
These tools combine alerts, analysis, and performance data to support corrective action.
As a result, administrators can respond to application concerns with better information.
Proactive Issue Detection
Proactive monitoring helps administrators detect issues before they affect end users.
Alerts identify deviations from expected performance levels.
Administrators can then investigate conditions and take corrective action.
- Performance monitoring reveals emerging application concerns.
- Notifications inform administrators about unexpected performance changes.
- Early detection supports faster responses to application issues.
Root Cause Analysis
Automated root cause analysis helps administrators investigate performance issues quickly.
Performance metrics and transaction traces expose underlying bottlenecks.
Administrators can use these findings to guide remedial actions.
- Automated analysis narrows the search for underlying problems.
- Transaction data helps administrators locate performance bottlenecks.
- Root cause findings support targeted corrective measures.
Application Performance Optimization
Application monitoring helps administrators find and address performance bottlenecks.
Performance trends provide useful information for application improvement decisions.
User interaction analysis also supports efforts to improve application experiences.
- Administrators can use monitoring data to improve application performance.
- Trend analysis supports informed performance decisions.
- User interaction data helps guide experience improvements.
Delve into the Subject: Tech Evangelist Job Description and Responsibilities
Integration and Analytics Capabilities of System Monitoring Tools
System monitoring tools support reliable operation and performance across complex information technology environments.
Integrations connect monitoring data with related platforms and help administrators understand infrastructure conditions.
Analytics add context by revealing patterns, unusual activity, and resource concerns over time.
Integration with Other Systems and Tools
Monitoring platforms can connect with network tools, cloud platforms, and ticketing systems.
These connections combine information from multiple sources within a broader operational view.
Administrators can then investigate issues earlier and coordinate appropriate responses.
- Network integrations connect infrastructure data with network monitoring information.
- Cloud integrations extend monitoring across cloud-based systems and services.
- Ticketing integrations help administrators track issues and coordinate corrective actions.
Analytics Features for Infrastructure Insights
Analytics features help administrators examine performance and usage patterns across the infrastructure.
Historical data reveals trends, anomalies, and bottlenecks that may affect system performance.
Administrators can use these insights to optimize resources and improve operational efficiency.
- Trend analysis highlights changes in system performance over time.
- Anomaly detection identifies unusual behavior that requires further investigation.
- Resource analysis supports informed decisions about infrastructure efficiency.
Predicting and Preventing System Issues
Advanced analytics can reveal patterns that precede system failures or performance degradation.
Proactive monitoring gives administrators time to take preventive action before users experience disruptions.
These practices support reliability and help minimize downtime.
- Historical analysis helps identify conditions associated with potential system failures.
- Pattern recognition can highlight early signs of performance degradation.
- Preventive actions help administrators maintain system stability and user experience.
Integration and analytics help administrators manage infrastructure performance, reliability, and security more effectively.
Find Out More: Job Outlook for Edge Computing Specialists in 2025
Best Practices for Effective System Monitoring
As a systems administrator, setting up and configuring monitoring tools supports optimal system performance.
Effective monitoring also helps administrators maintain system health.
- First, choose a monitoring tool that aligns with system requirements and infrastructure.
- Configure the tool to monitor critical performance indicators for system health.
- Ensure the tool scales with system growth to prevent monitoring gaps.
- Regularly update and optimize settings to improve performance and accuracy.
- Configure the tool to monitor critical performance indicators for system health.
- Next, establish baseline metrics, alerting thresholds, and custom reports.
- Define baseline metrics for normal performance to identify deviations and anomalies.
- Set alerting thresholds based on baseline metrics to identify potential issues.
- Create custom reports that reveal performance trends and outliers.
- Regularly review and adjust metrics, thresholds, and reports after system changes.
- Define baseline metrics for normal performance to identify deviations and anomalies.
- Finally, continuously monitor and analyze system data to address performance bottlenecks.
- Implement real-time monitoring to detect issues before they affect performance.
- Analyze historical data to identify recurring patterns and performance bottlenecks.
- Use trend analysis to predict requirements and optimize resource allocation.
- Share insights with team members to support efficient troubleshooting and resolution.
- Implement real-time monitoring to detect issues before they affect performance.
By following these practices, systems administrators can monitor systems effectively.
They can also address performance issues before those issues escalate.
Maintaining System Health Through Monitoring
System monitoring tools help systems administrators maintain system health effectively.
Therefore, administrators should explore available tools and follow current monitoring trends to support optimal performance.
Additionally, readers can share their experiences and recommend effective tools within a knowledge-sharing community.


