






What to do when work hours are cut starts with a clear record: hours wanted, hours offered, hours actually paid and hours you can feasibly work. Measure those separately before comparing a restored schedule, compatible extra work or a new role.
October’s jobs report gives national context, but it cannot explain your employer’s decision. This guide combines that evidence with a wholly fictional four-week ledger. Five charts, a three-path infographic and four free CSV tools make the calculations and their limits visible.
Read the October reduced-hours figures carefully
The BLS release published 6 November 2026 reports 4.840 million people working part time for economic reasons in October, seasonally adjusted. That was 339,000 above September’s 4.501 million. August’s estimate was 4.390 million.
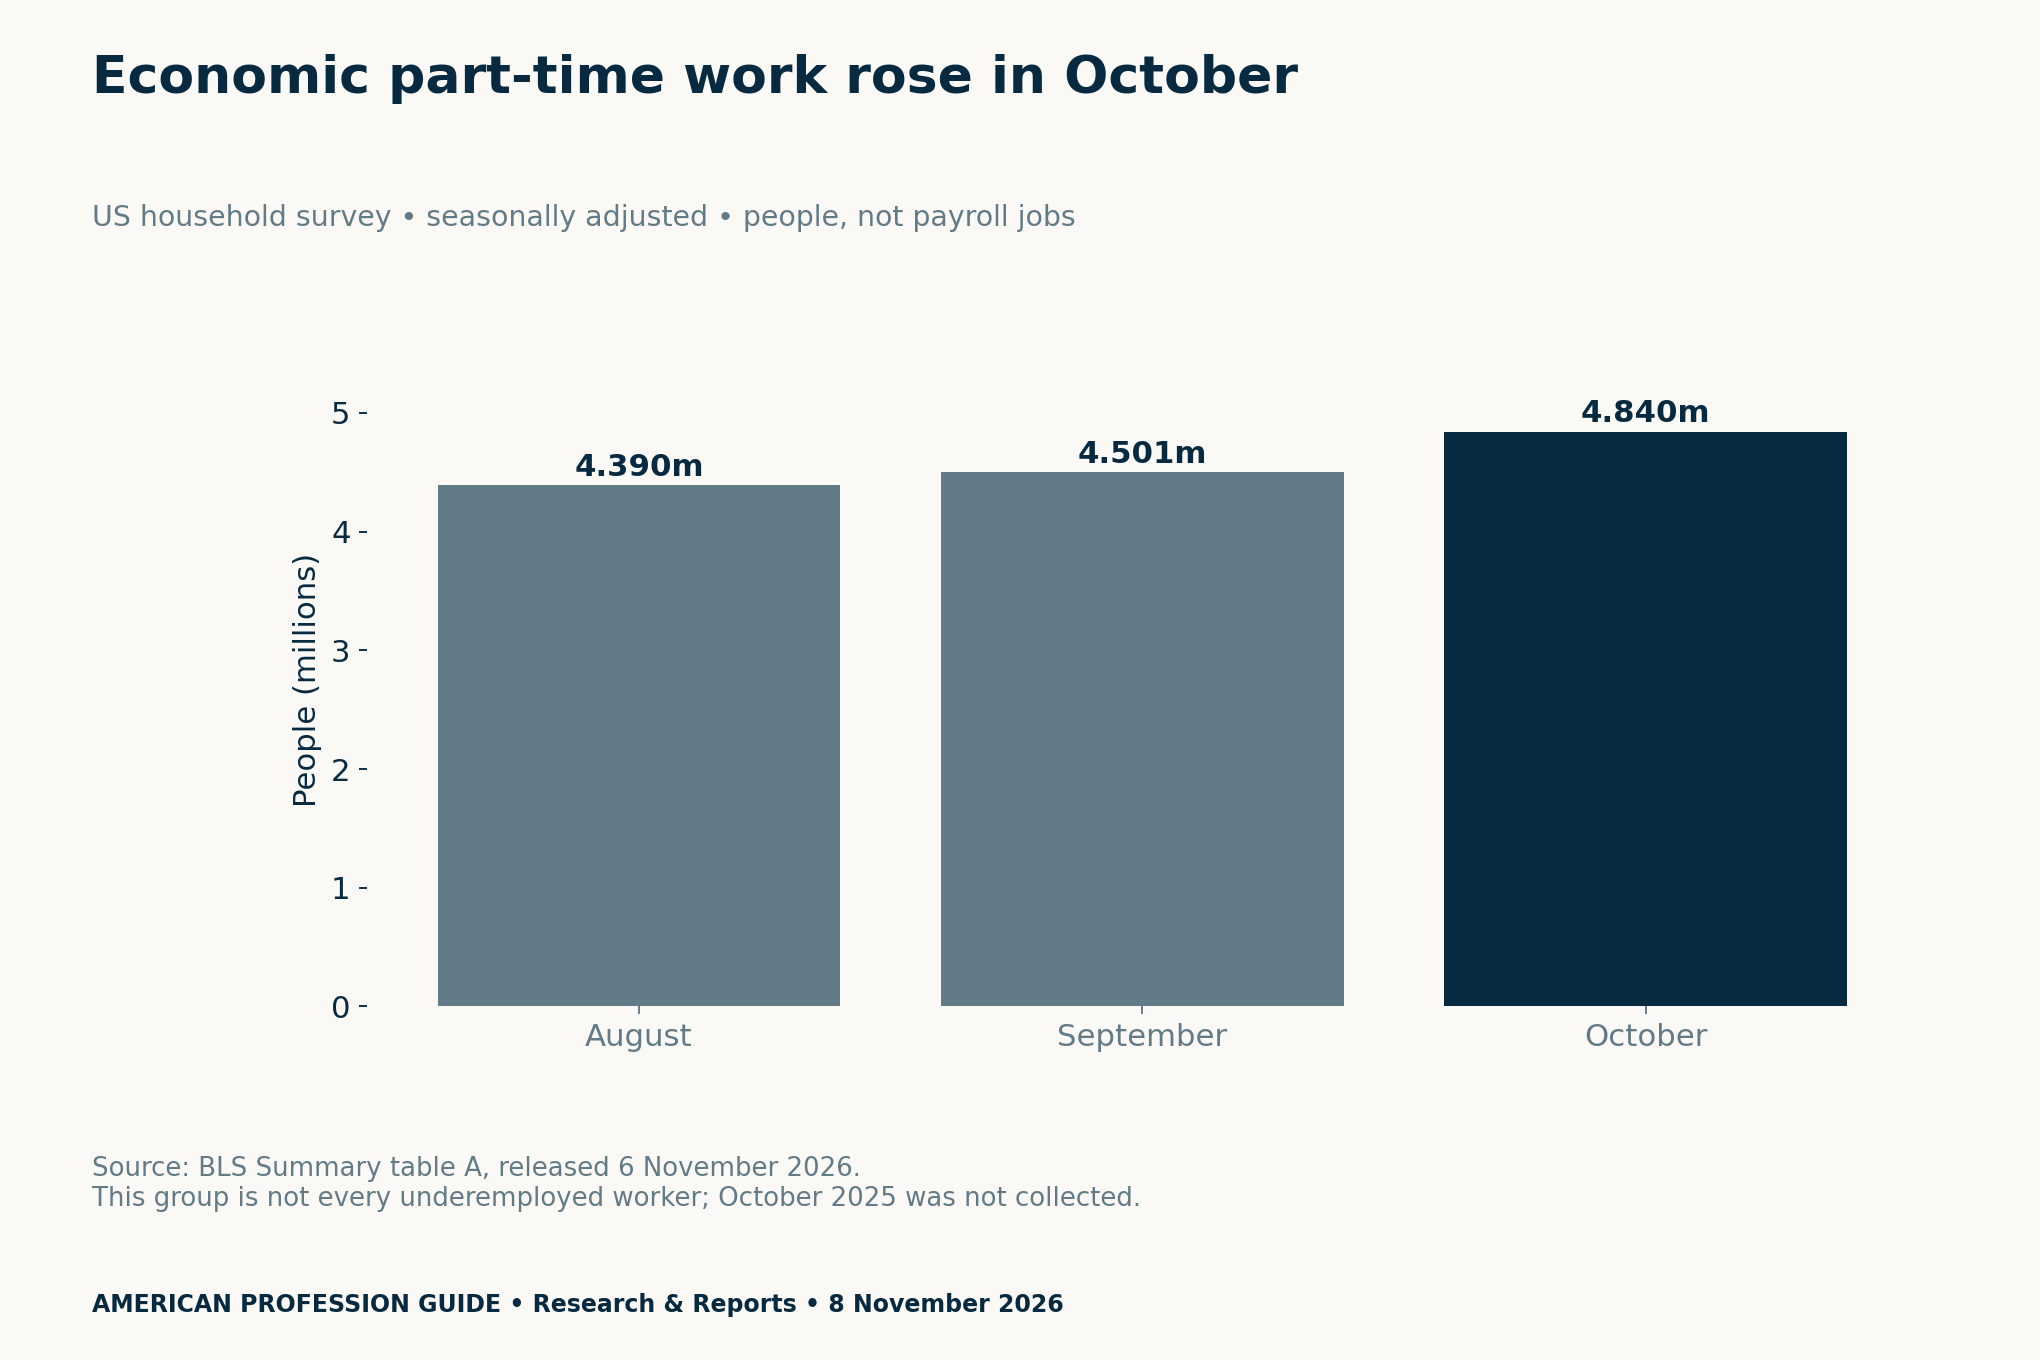
BLS describes this group as people who preferred full-time work but worked part time because employers reduced their hours or they could not find full-time jobs. The figures provide context. However, they do not establish why an individual’s hours changed or whether a particular schedule will recover.
| Seasonally adjusted measure | September 2026 | October 2026 | Change |
|---|---|---|---|
| Economic part-time headline | 4,501,000 | 4,840,000 | +339,000 |
| Slack work or business conditions | 2,896,000 | 3,252,000 | +356,000 |
| Could only find part-time work | 1,267,000 | 1,265,000 | −2,000 |
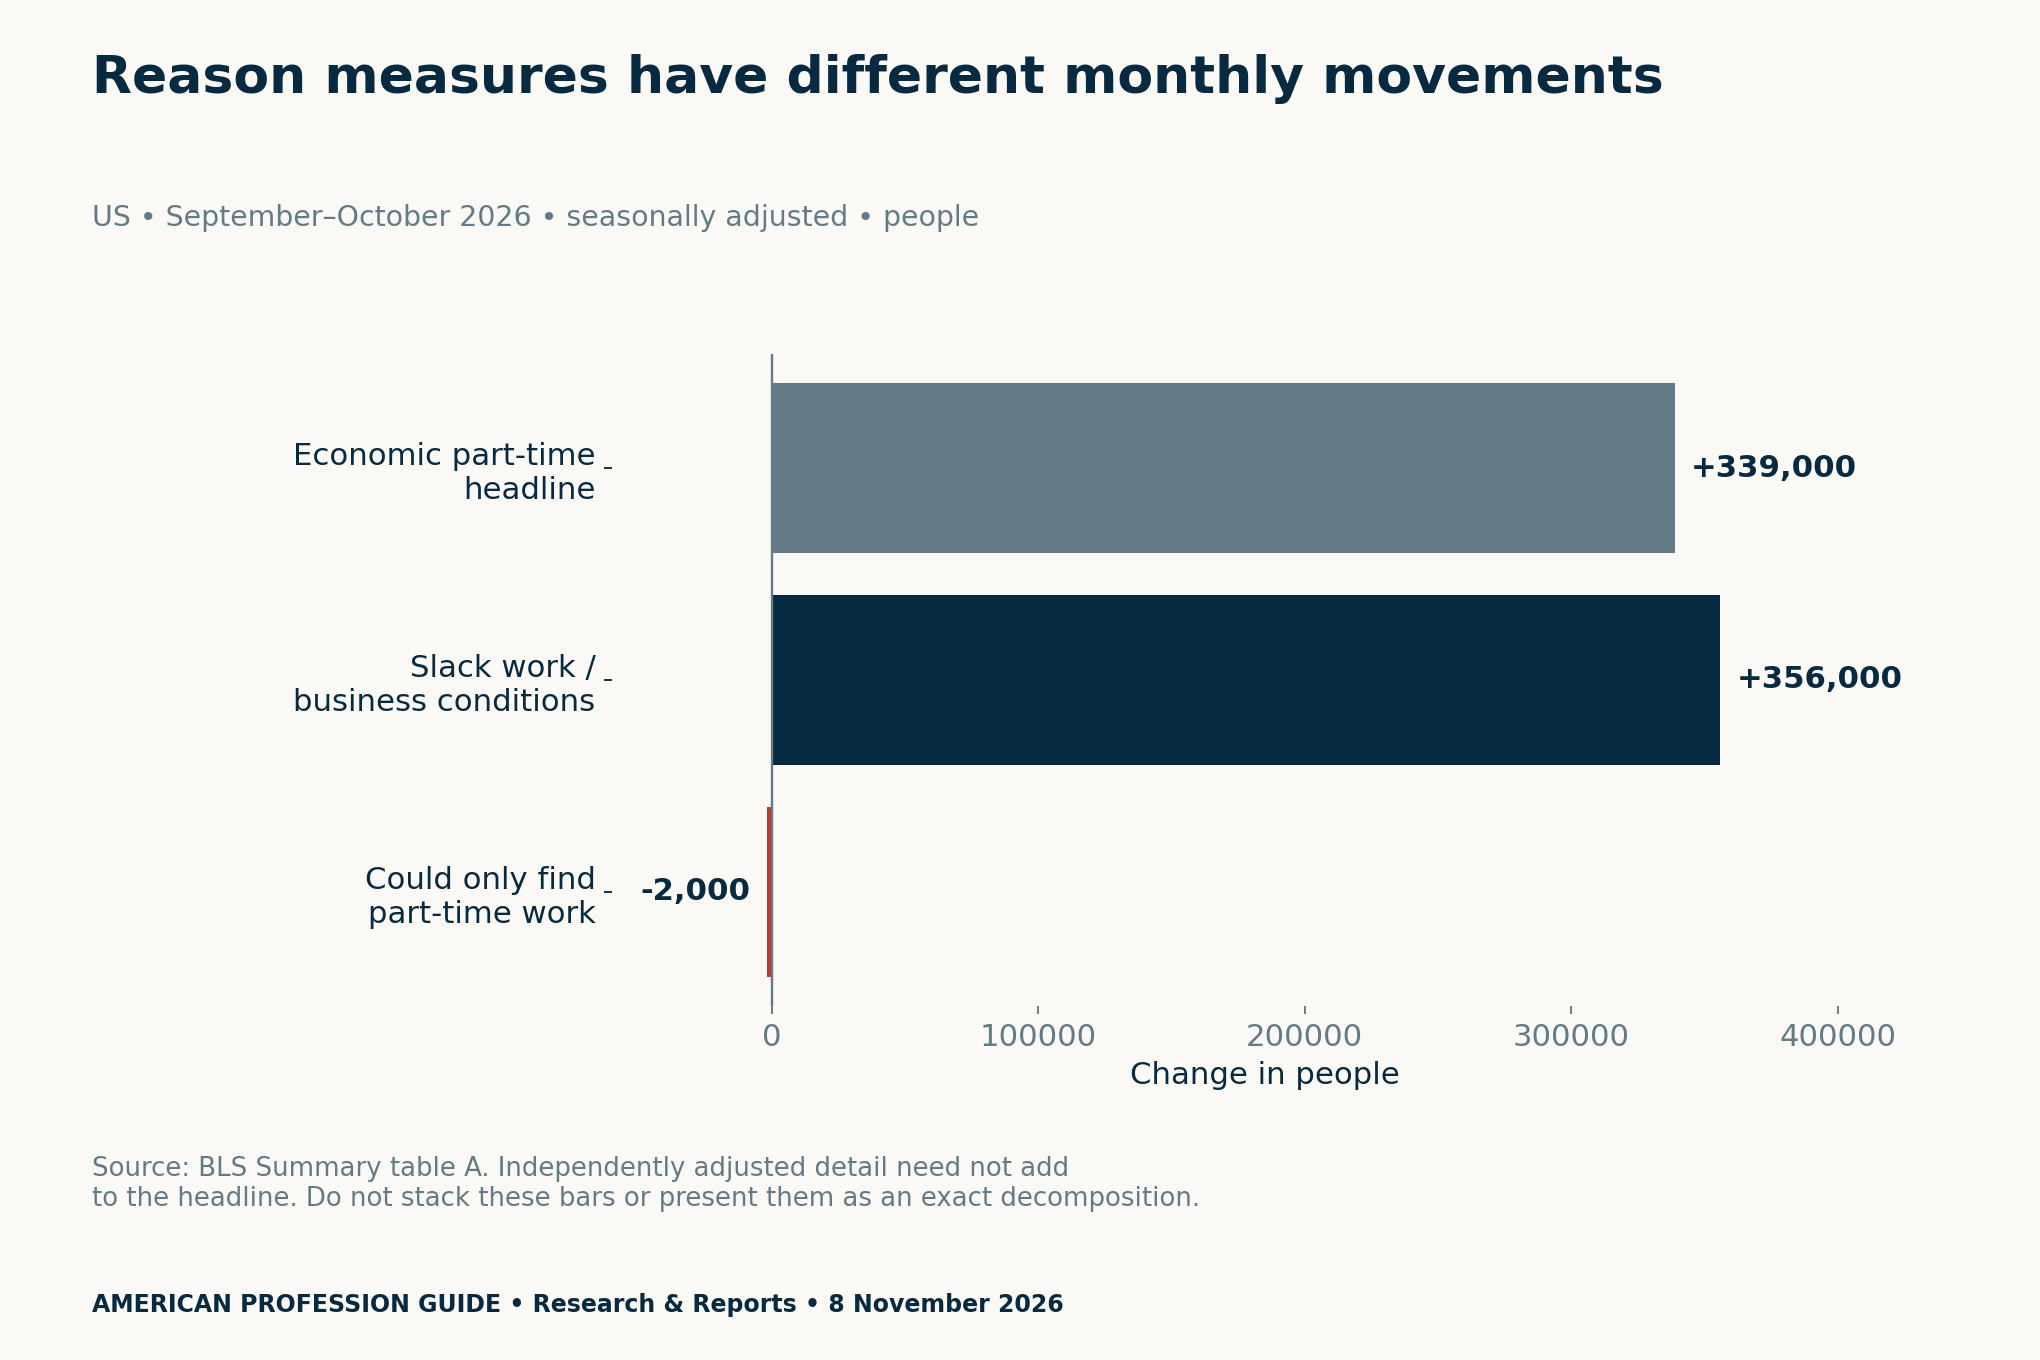
The table marks October 2025 as unavailable because BLS did not collect data during the federal shutdown. We do not fill it with zero or interpolate a year-on-year change. National survey estimates also cannot determine benefit eligibility, employment rights or financial entitlement.
What to do when work hours are cut: build your record
Keep the original schedule and later updates where you are permitted to retain them. Record dates and source references without unnecessary personal information. Separate an offered shift from one actually worked and paid. If you have a payment dispute, use the appropriate qualified advice route rather than treating this planning file as a legal assessment.
Wanted hours describe your preference. Offered hours describe the employer’s schedule at that point. Actually paid hours record what the pay evidence supports. Feasible availability describes your constraints, including existing commitments. For example, a gap against wanted hours may exceed the hours you could currently accept.
Use the fictional four-week ledger
Our teaching worker wants 40 hours every week and has an invented unchanged rate of $20 per hour. Offered hours are 32, 28, 30 and 34. Actual paid hours are 30, 26, 28 and 32. Feasible availability is 40, 38, 40 and 36 hours.
| Fictional week | Wanted | Offered | Actually paid | Feasible |
|---|---|---|---|---|
| 1 | 40 | 32 | 30 | 40 |
| 2 | 40 | 28 | 26 | 38 |
| 3 | 40 | 30 | 28 | 40 |
| 4 | 40 | 34 | 32 | 36 |
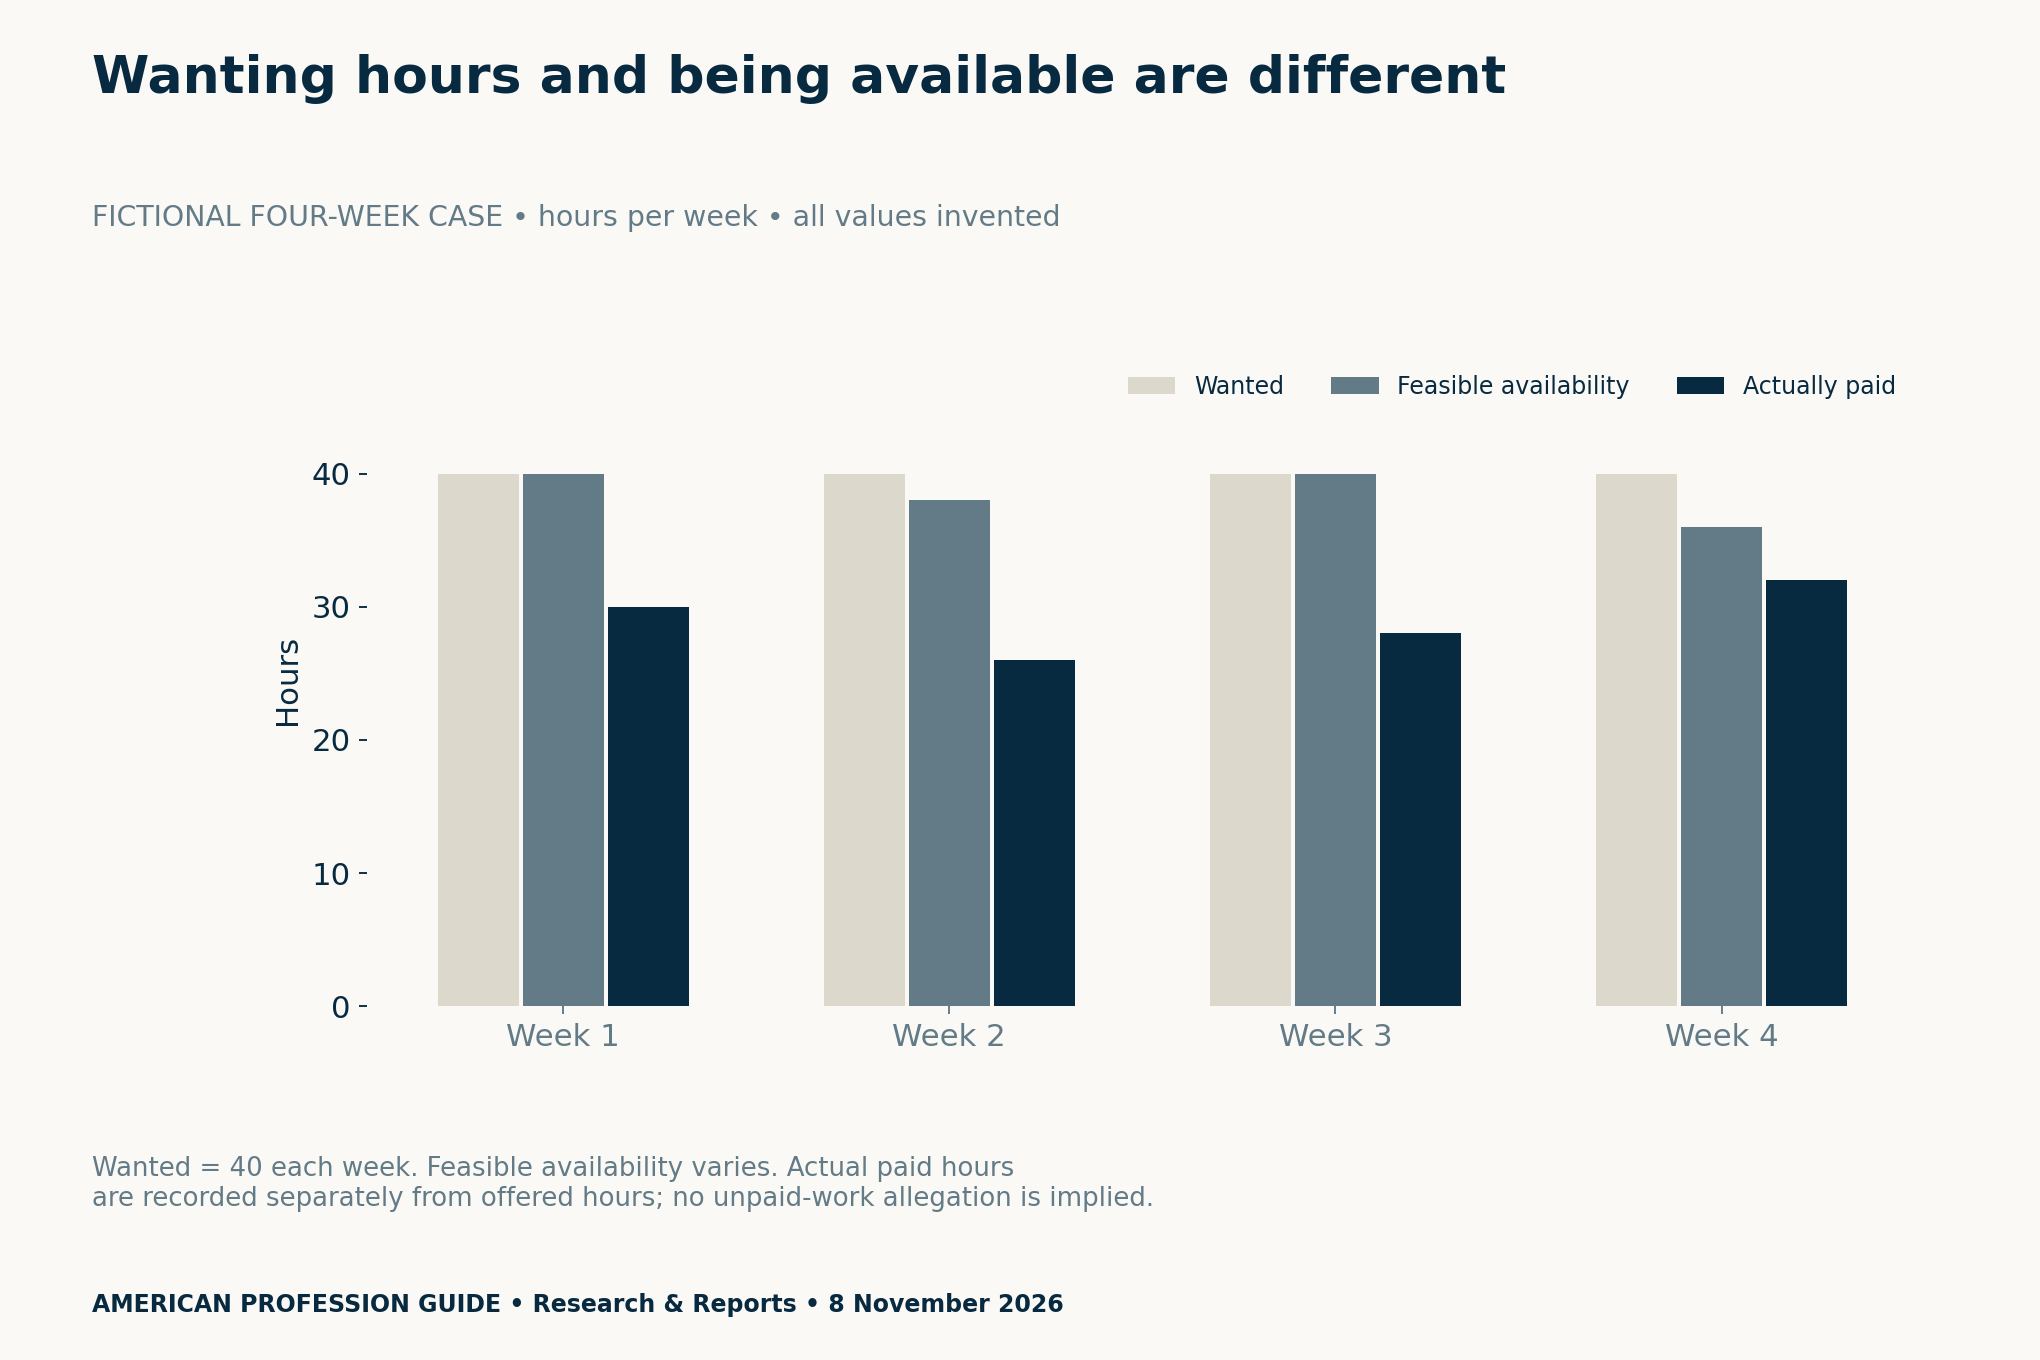
Across four weeks, wanted hours total 160 and actual paid hours total 116. The difference is 44 hours. Feasible availability totals 154, leaving a smaller gap of 38 hours against paid work. Neither calculation guarantees that an employer or another job can supply those hours.
Calculate gross shortfall without calling it take-home pay
At the invented $20 rate, the wanted-hours comparison is 44 × $20 = $880 across four weeks. Weekly amounts are $200, $280, $240 and $160. The feasible-availability comparison is 38 × $20 = $760. Thus, both use the same unchanged rate but explicitly different hour bases.
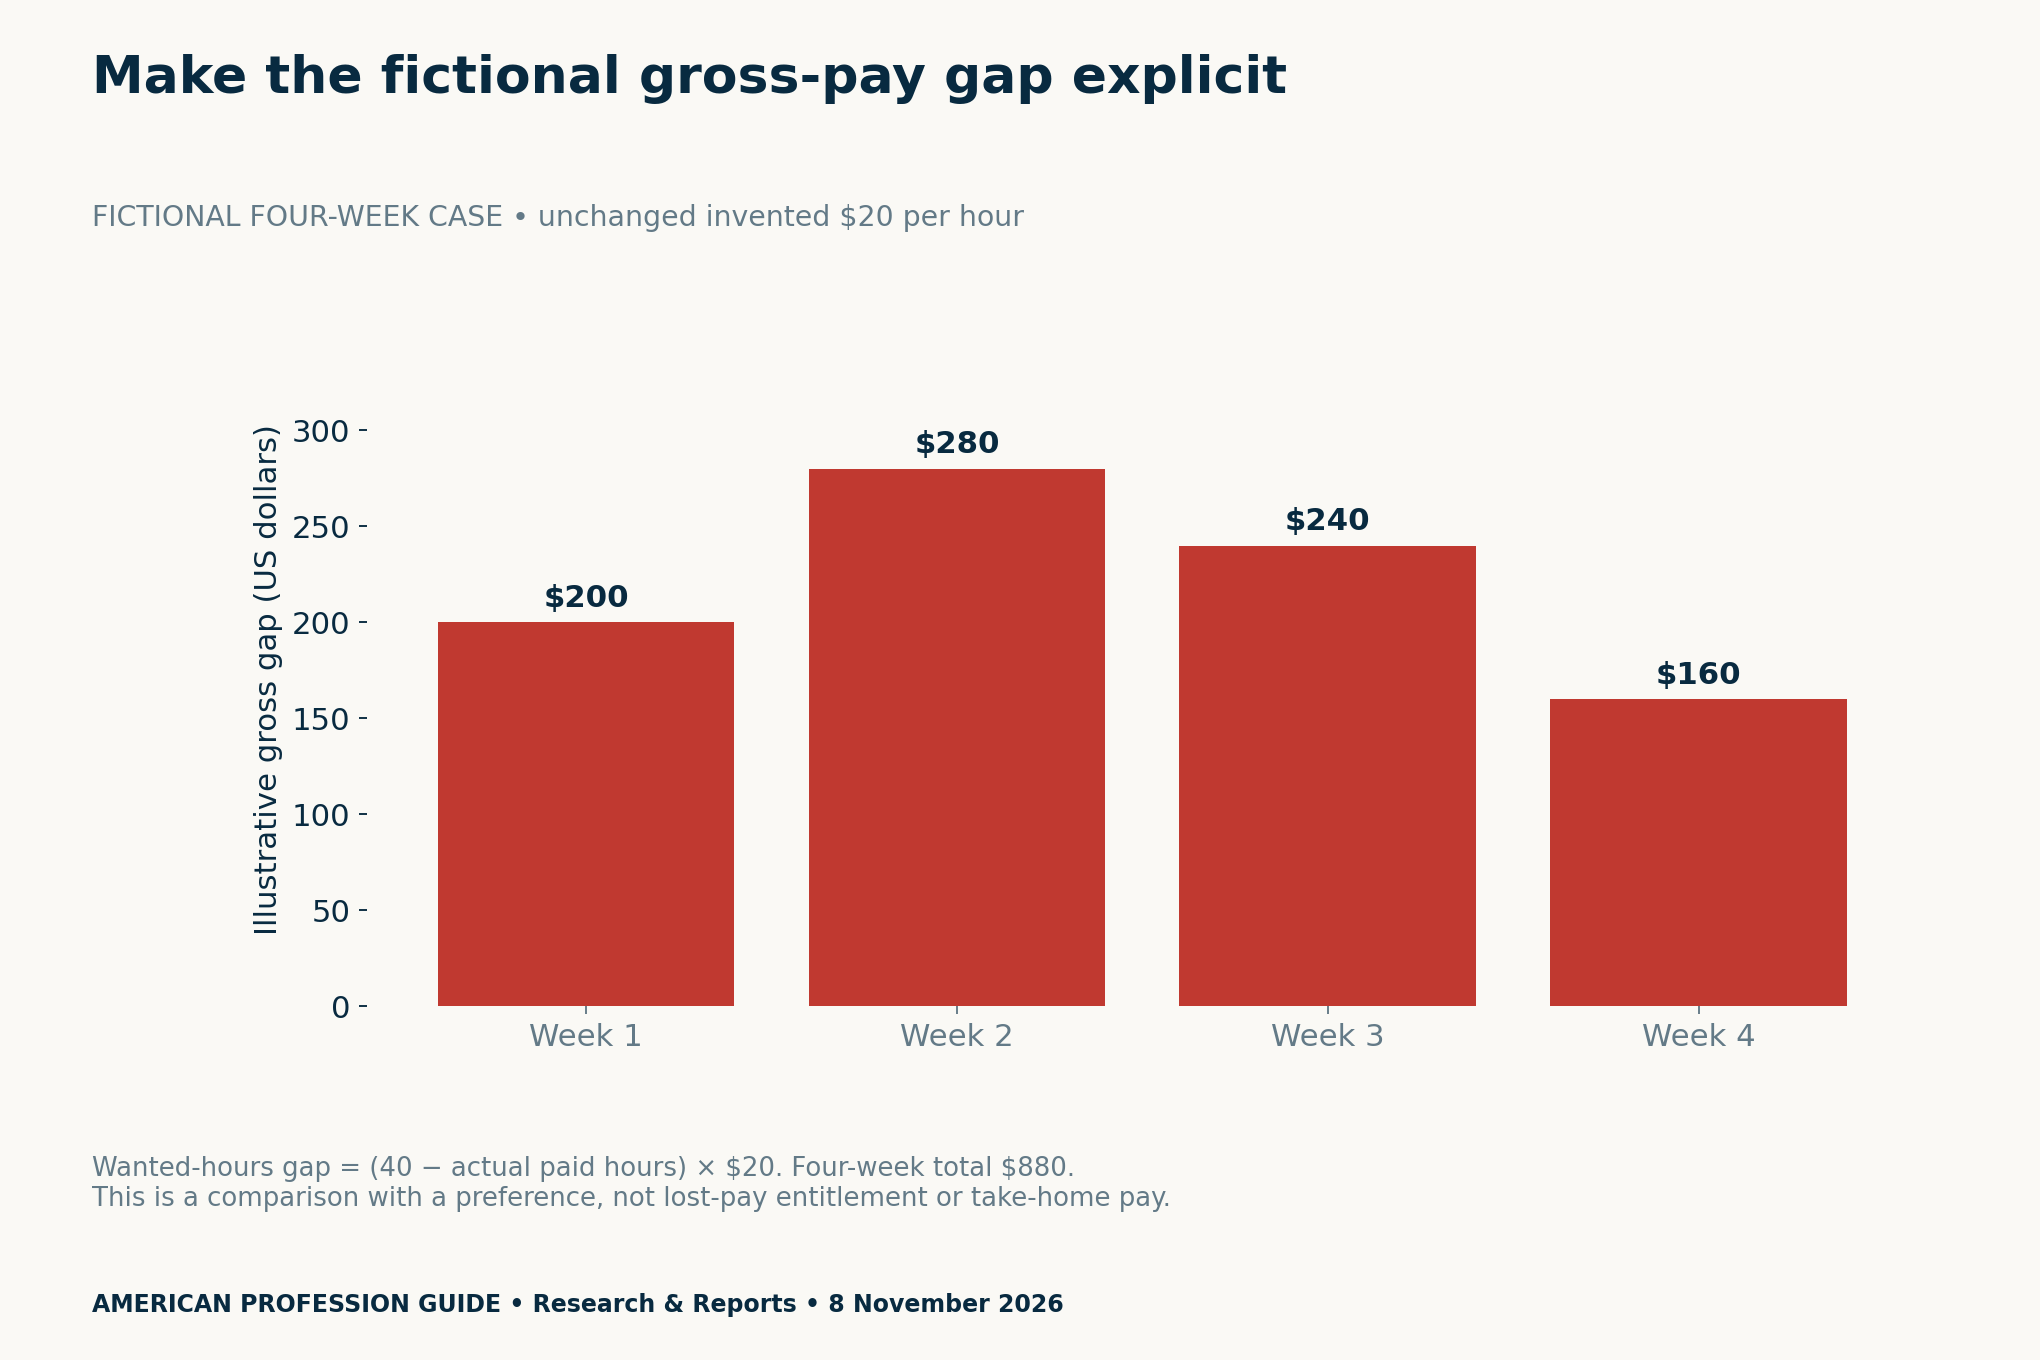
Do not multiply this four-week amount into an annual loss without evidence that the same schedule persists. Overtime, different rates, unpaid breaks and payroll rules would need their own treatment. This deliberately simple case does not model them, and it cannot decide your actual entitlement.
Compare three possible paths, with constraints
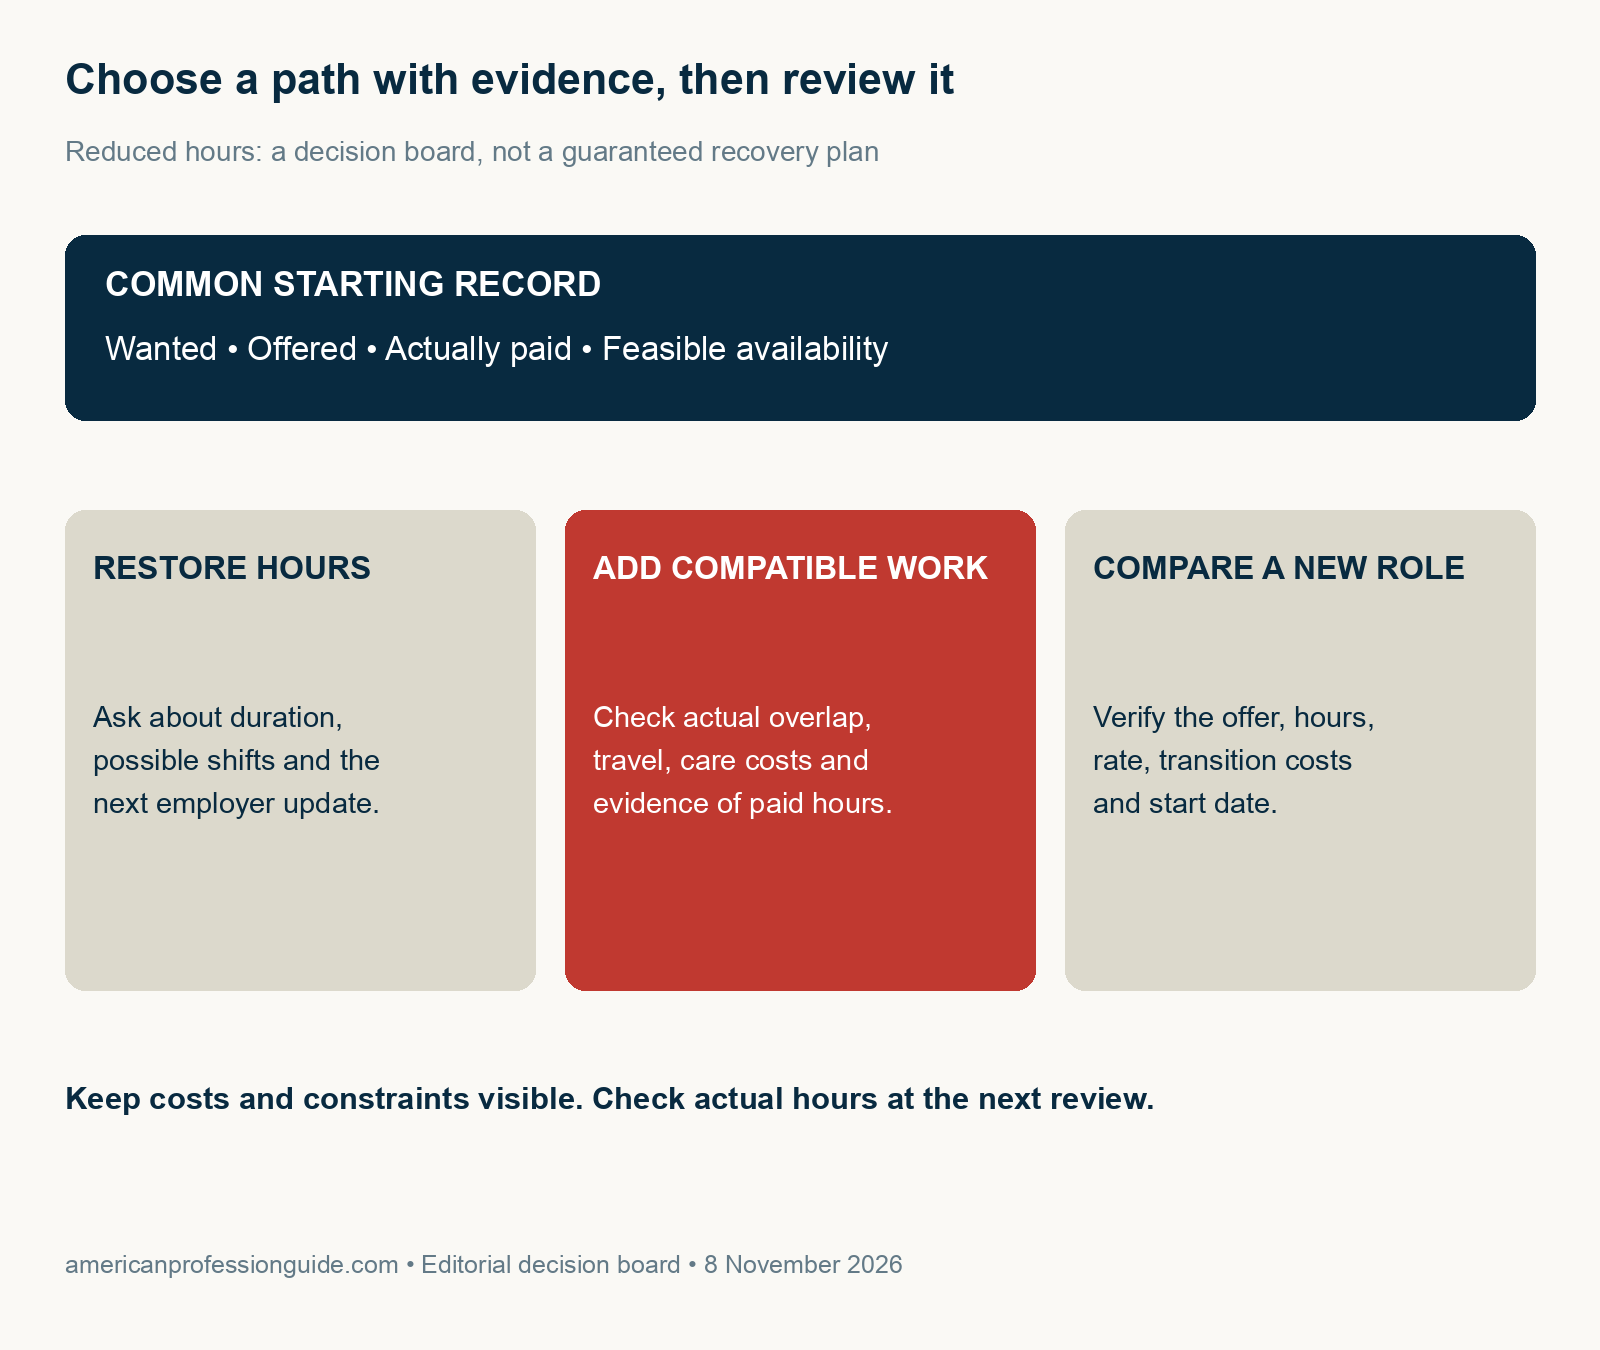
For restoring hours, ask how long the reduction is expected to last, which shifts might be available and when the next update will arrive. Record a promise separately from an actual paid shift. An uncertain answer should stay uncertain in the worksheet.
For compatible work, check genuine schedule overlap, travel time, care needs and any applicable employment conditions. However, a second role is not costless merely because the hourly rate looks useful. Record costs separately; do not invent local prices or assume they will be reimbursed.
For a new role, verify the actual offer, rate, stated hours, start date and transition costs. Use the working-hours and assignment checklist for questions to ask. A job advertisement or national growth figure is not an offer.
A one-week scenario is a comparison, not a promise
A separate fictional baseline uses 28 paid hours at $20, or $560 gross. Restoring six hours gives 34 hours and $680. Adding six compatible hours at the same invented rate also gives $680. A hypothetical replacement role of 36 hours gives $720. No such shifts or offer exist in this teaching example.
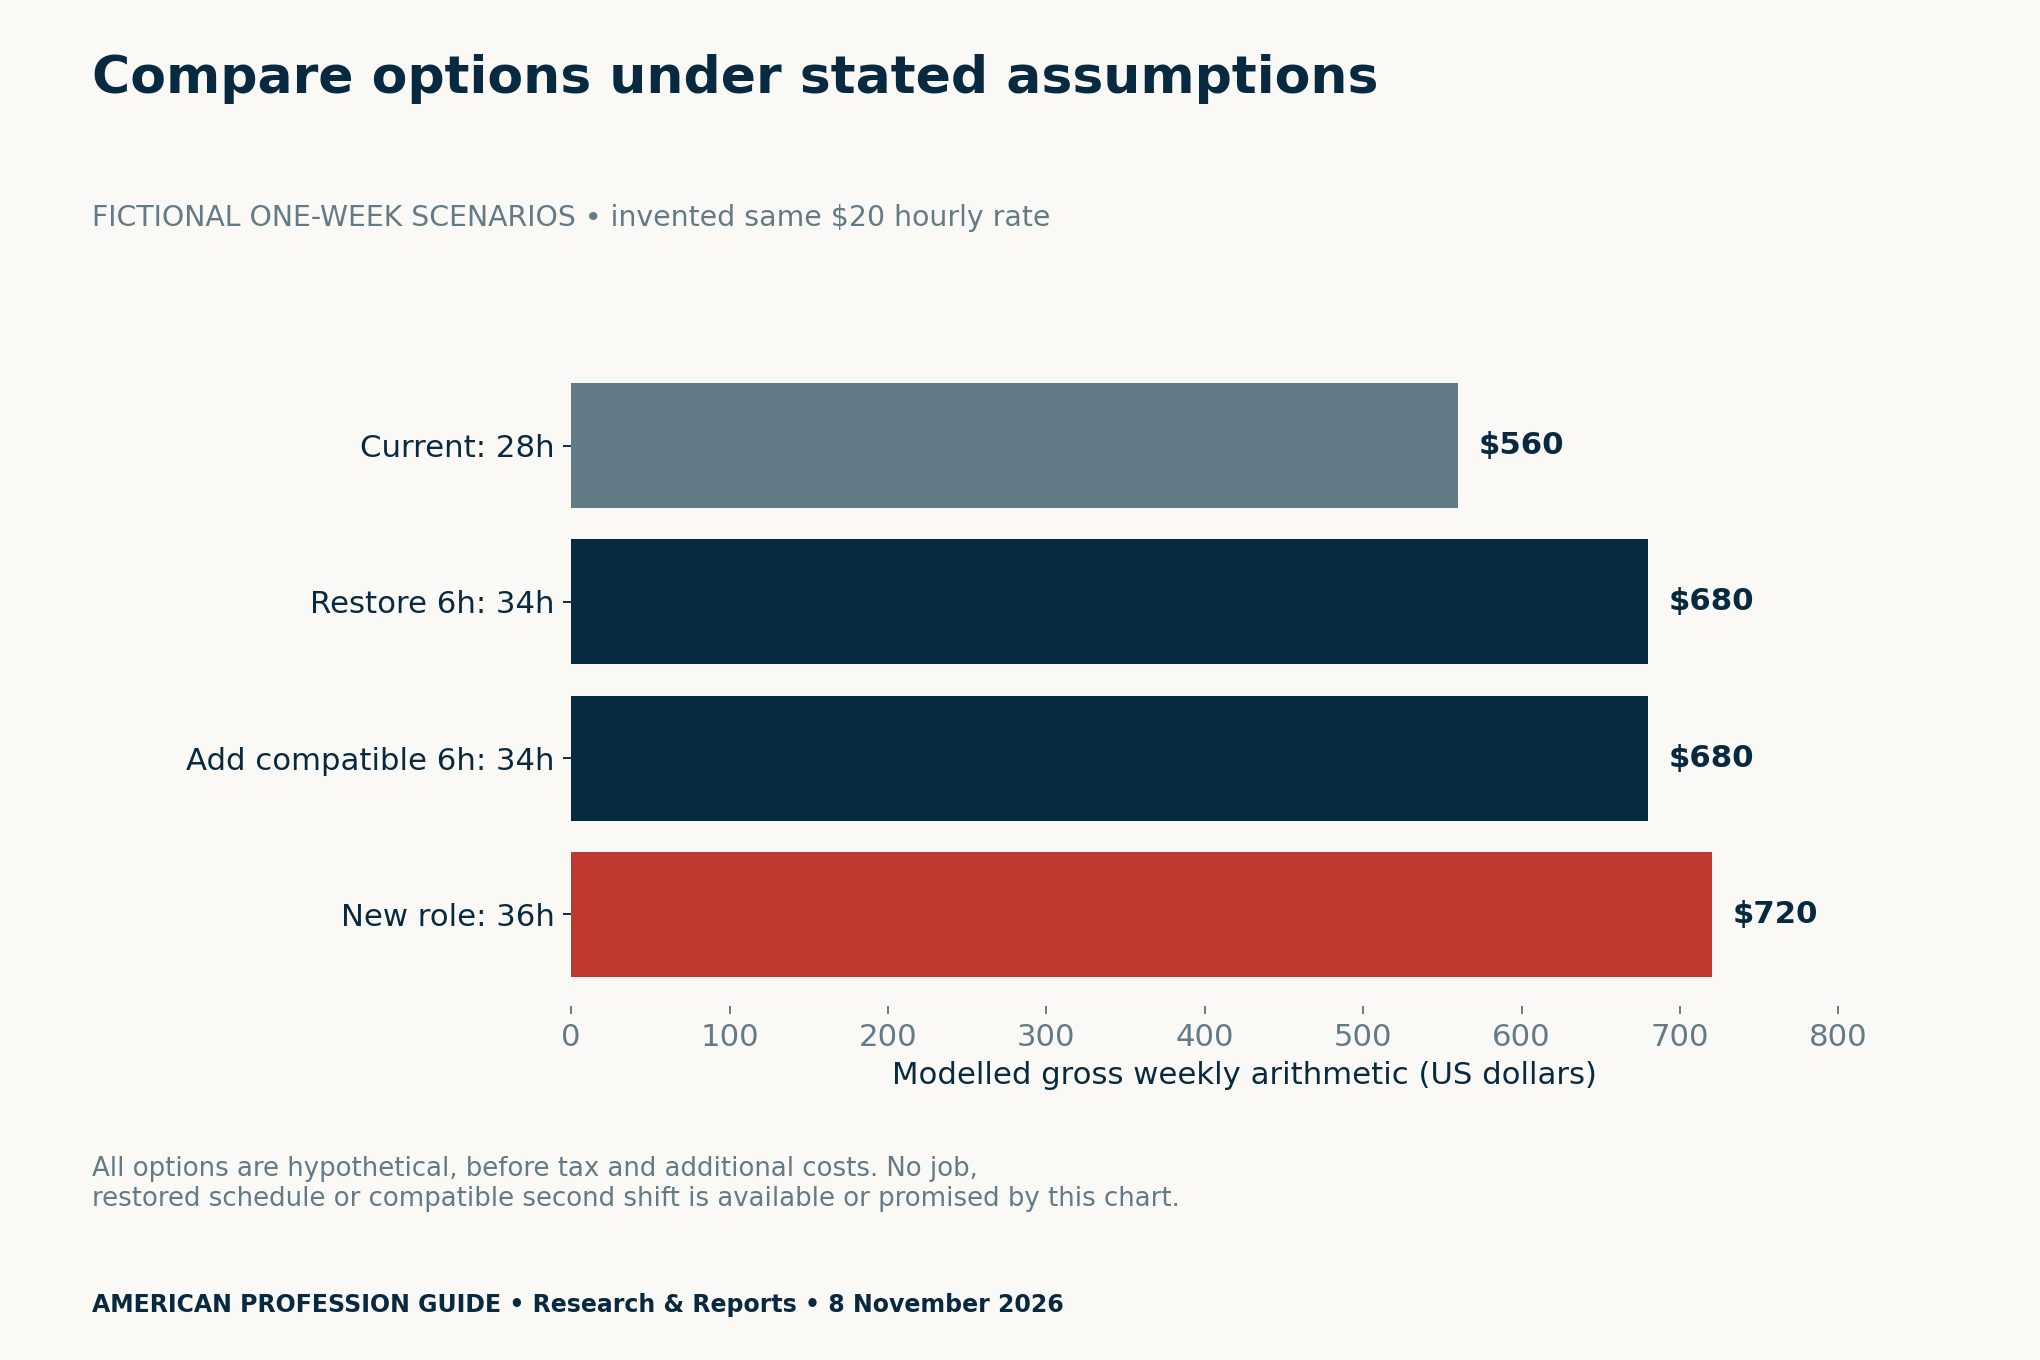
Keep the four-week ledger separate from these one-week scenarios because they answer different questions. Before using a scenario personally, replace every invented input with verified evidence, leave unknowns blank and record whether the arrangement fits feasible availability.
Download the reduced-hours planning files
- BLS measures, reference periods and adjustment notes (CSV)
- Fictional four-week hours and gross-gap ledger (CSV)
- Fictional one-week option comparisons (CSV)
- Blank four-week hours and constraints review (CSV)
All downloads are free with no login. The blank review includes separate fields for travel costs, care or other costs, conflicts, training time, employer updates and evidence. It does not silently subtract guessed expenses or assign an unsupported suitability score.
Review actual evidence after four weeks
We have not conducted a worker study or recovery trial. For example, a future four-week review could compare recorded offers with actual paid hours, date employer updates and revisit each option’s costs and constraints. It could describe that person’s record; it would not prove a strategy improves earnings generally.
If you also compare industries, our courier and warehouse payroll analysis explains why national changes do not measure local vacancies. Specialist legal, tax or benefits questions need current qualified advice and the relevant official sources for your jurisdiction; this worksheet determines none of those outcomes.
Methodology and boundaries
We checked the archived 6 November BLS release on 8 November 2026. We retain Summary table A values in thousands and convert them consistently to people for the article. The published reason measures remain separate because independent seasonal adjustment can prevent exact addition.
The teaching ledger and one-week options are original invented arithmetic. For each week, subtract paid from wanted or feasible hours, then multiply by the stated unchanged rate. We verify the four weekly wanted-gap values sum to $880 and the feasible-gap values sum to $760. We used no real pay records or participant data.
What to do when work hours are cut depends on evidence about your own schedule and constraints. The purpose of these tools is to make those questions clearer, while keeping a national survey, a personal record and a hypothetical option distinct.


