






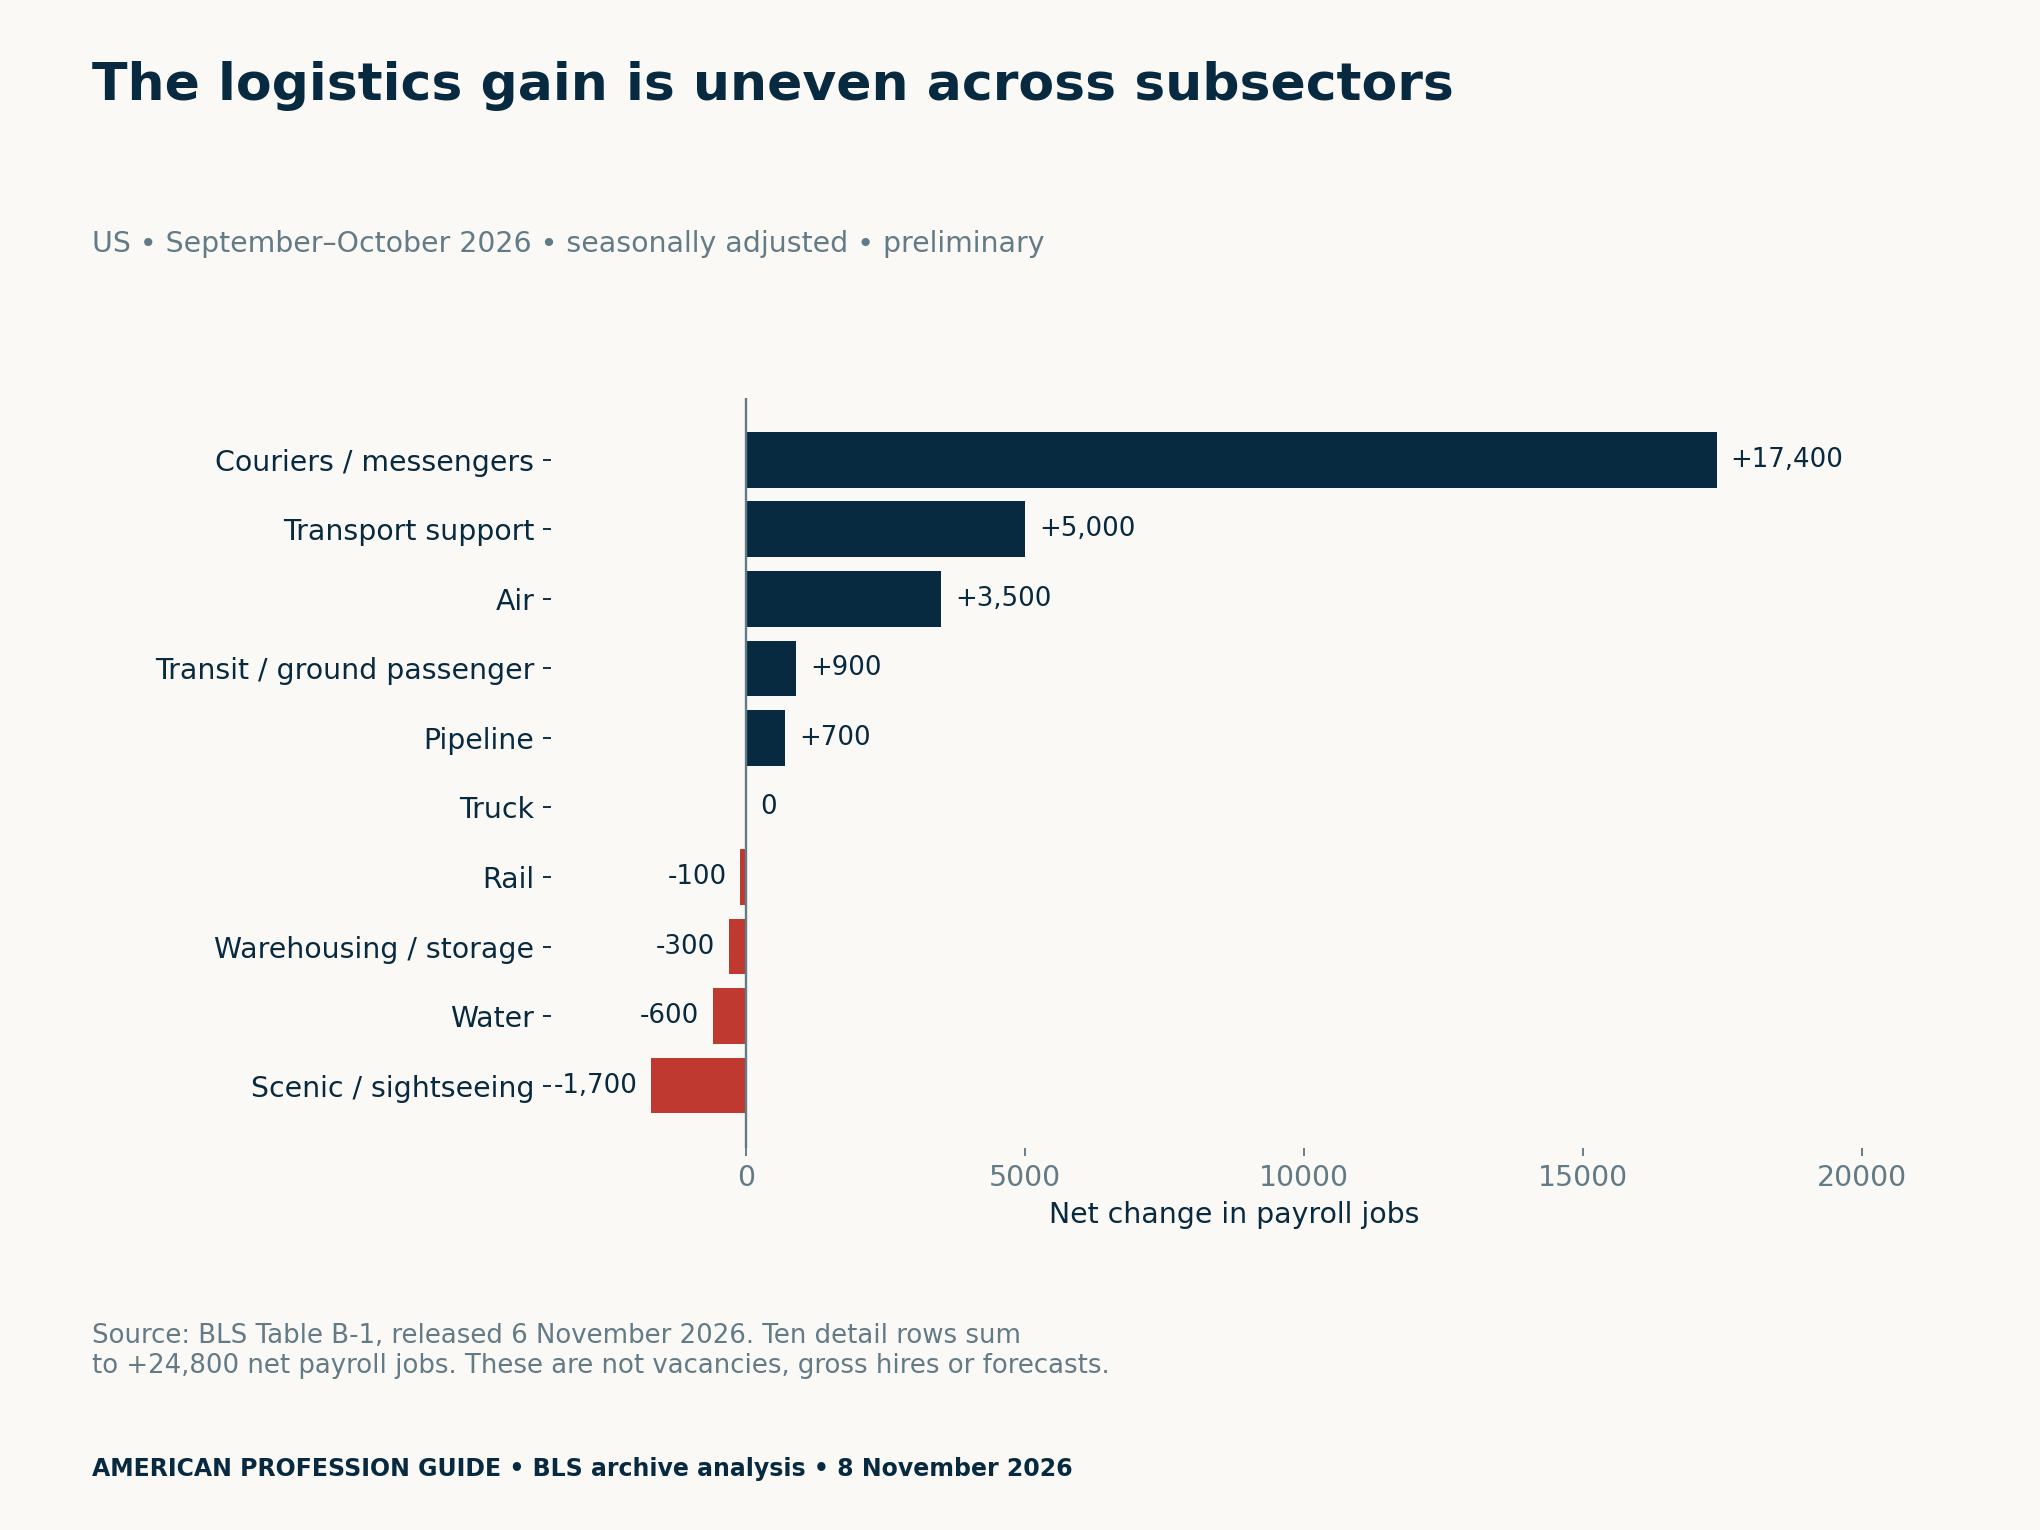
Courier vs warehouse job growth tells a more specific story than the logistics headline. October’s preliminary U.S. payroll data show couriers and messengers adding 17,400 jobs, while warehousing and storage lost 300. Both sit inside a sector that gained 24,800 jobs.
This report preserves every transportation subsector, explains the seasonal basis and offers a local vacancy evidence matrix. Five charts and four free CSV tools help you separate national industry movements from the evidence needed for a particular role.
Courier vs warehouse job growth: the October split
The 6 November 2026 BLS Employment Situation release measures October. Table B-1 supplies the precise seasonally adjusted change in thousands. Multiplying by 1,000 gives jobs. The release’s narrative rounds the sector increase to about 25,000; this analysis uses the table’s 24,800.
| Industry detail | September–October net jobs |
|---|---|
| Couriers and messengers | +17,400 |
| Support activities for transportation | +5,000 |
| Air transportation | +3,500 |
| Transit and ground passenger transportation | +900 |
| Pipeline transportation | +700 |
| Truck transportation | 0 |
| Rail transportation | -100 |
| Warehousing and storage | -300 |
| Water transportation | -600 |
| Scenic and sightseeing transportation | -1,700 |
| Sector total | +24,800 |
Air transportation added 3,500 jobs and support activities added 5,000. Truck transportation was unchanged. Rail, water, scenic transportation and warehousing recorded declines. Keeping all the rows prevents a positive sector total from being mistaken for uniform growth.
What the 70.2% courier contribution means
Divide 17,400 by the sector’s net gain of 24,800 and multiply by 100. Couriers account for approximately 70.2% of this net monthly increase. The denominator includes gains and losses across the sector. It is not the number of gross hires, vacancies or applications.
A pie chart would obscure that signed structure. Some subsectors subtract from the net total. We retain diverging bars and publish the contribution calculation in the derived CSV. A zero monthly change also does not mean employers made no hires: offsetting additions and departures can leave the net level unchanged.
Separate employment size from monthly movement
Warehousing and storage had 1,839,200 seasonally adjusted payroll jobs in October. Couriers and messengers had 1,107,400. The larger warehouse base does not contradict its small monthly decline. A stock tells you how many payroll jobs were counted; a change compares two dates.
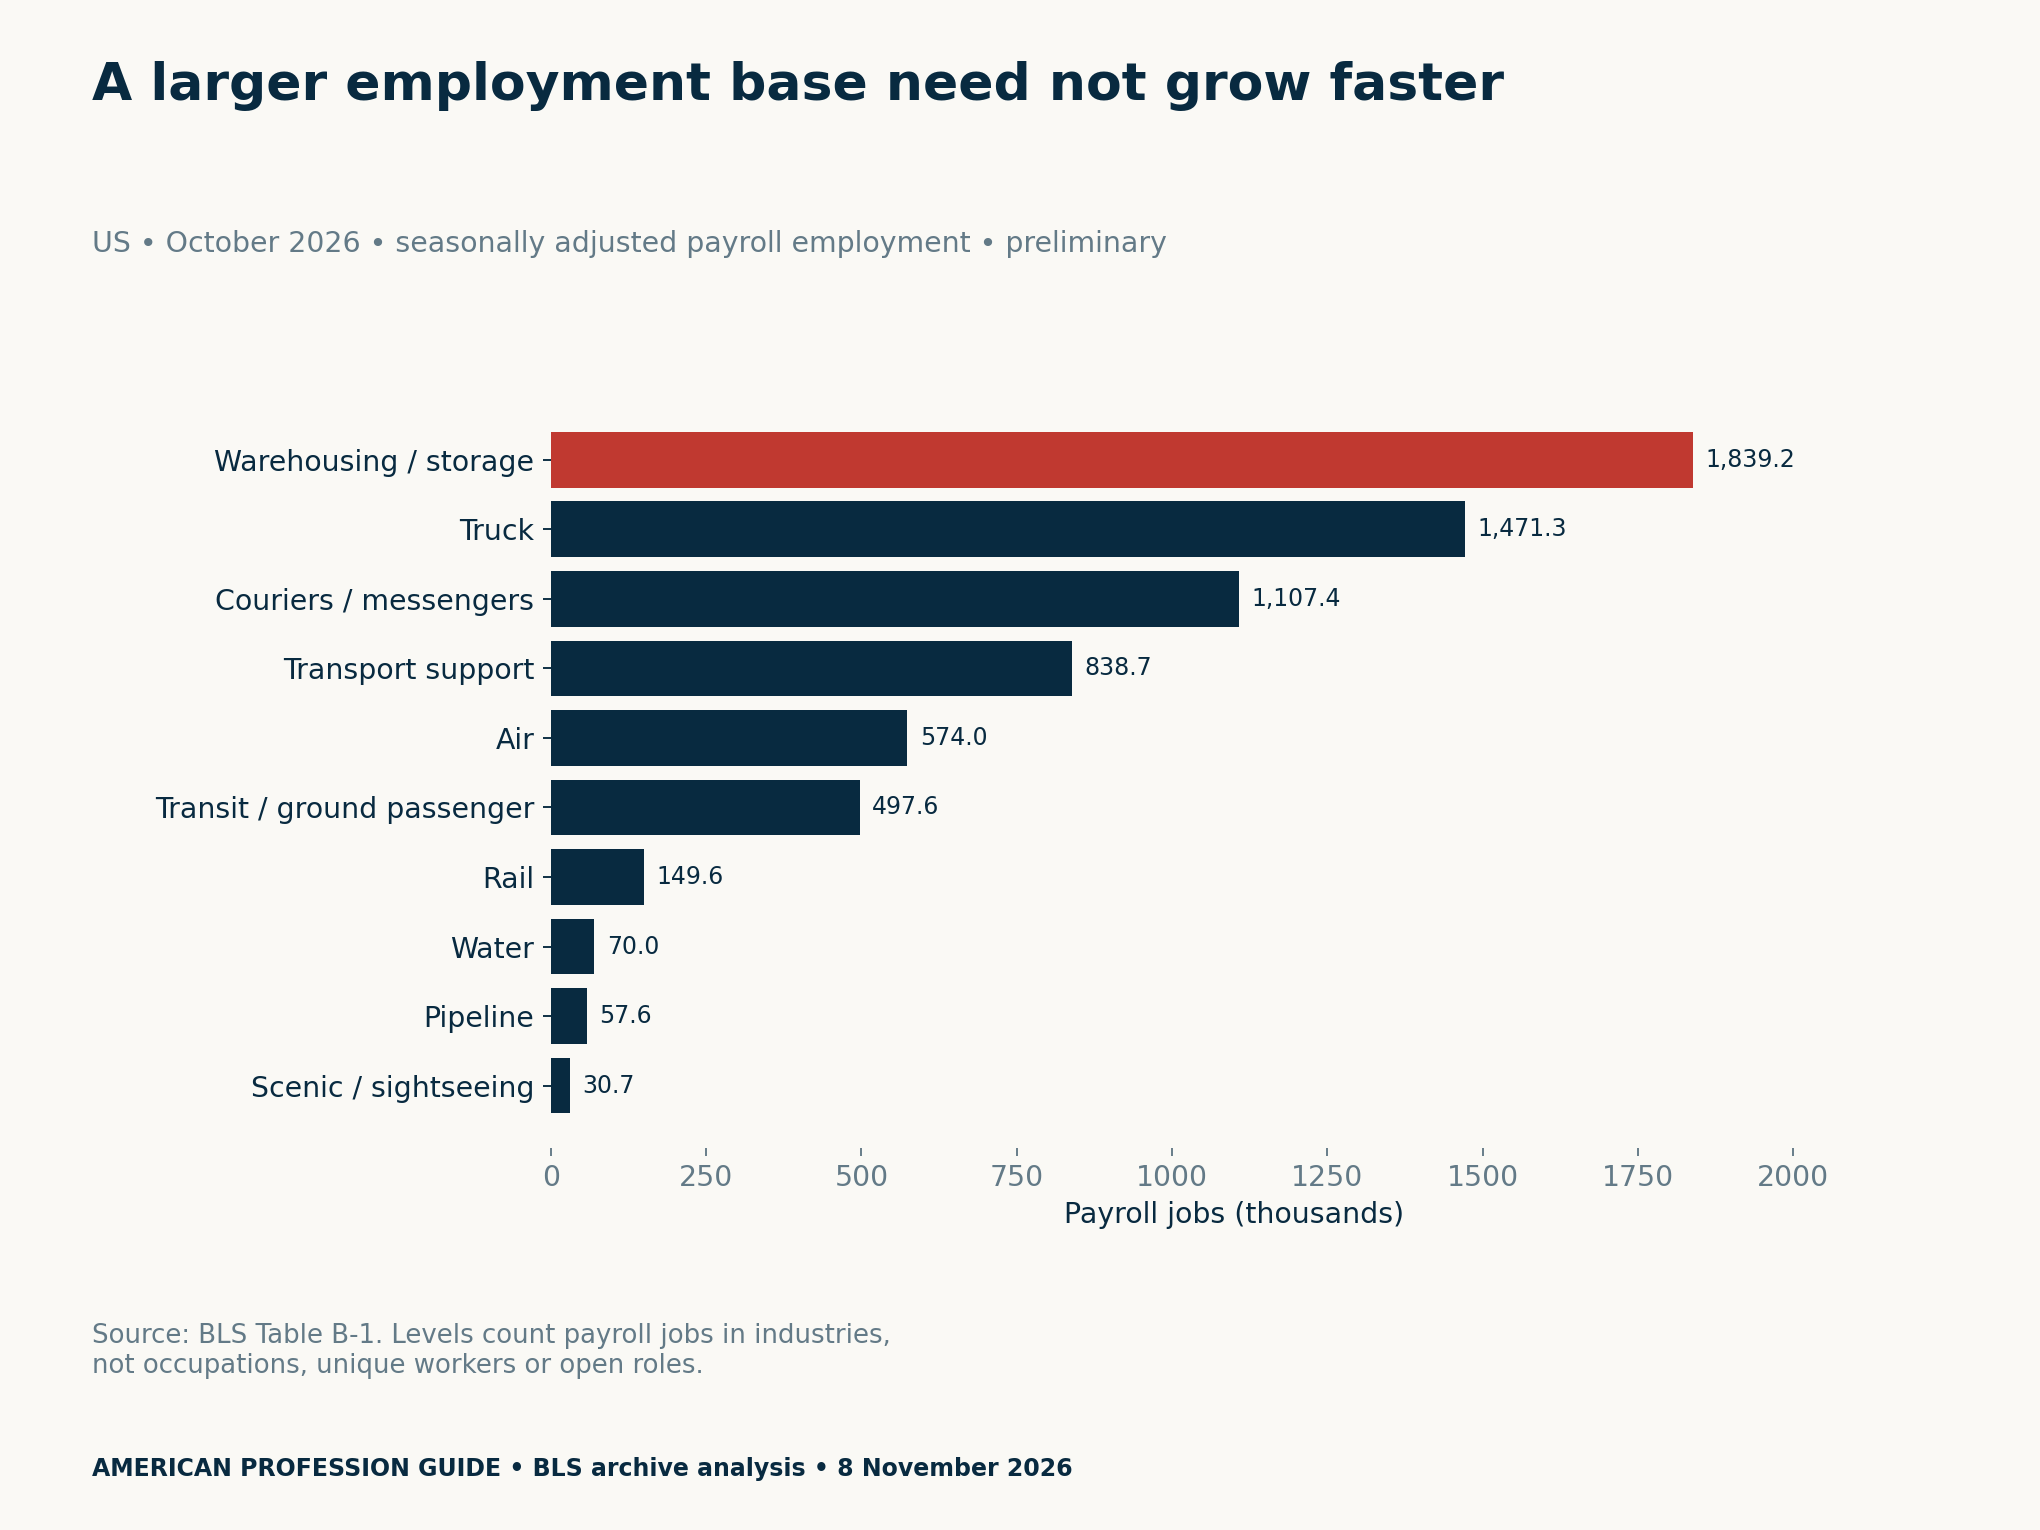
Do not add the sector total to its detail rows: it already contains them. Similarly, do not infer an individual hiring chance by dividing vacancies from one job board by this national employment base. The geography, timing and statistical unit would not match.
Compare rates with their own denominators
Couriers’ monthly increase is about 1.60% of September’s 1,090,000 jobs. Warehousing’s change is about −0.02% of its 1,839,500 September base. We retain unrounded arithmetic in the CSV and round chart labels to two decimals for comparison.
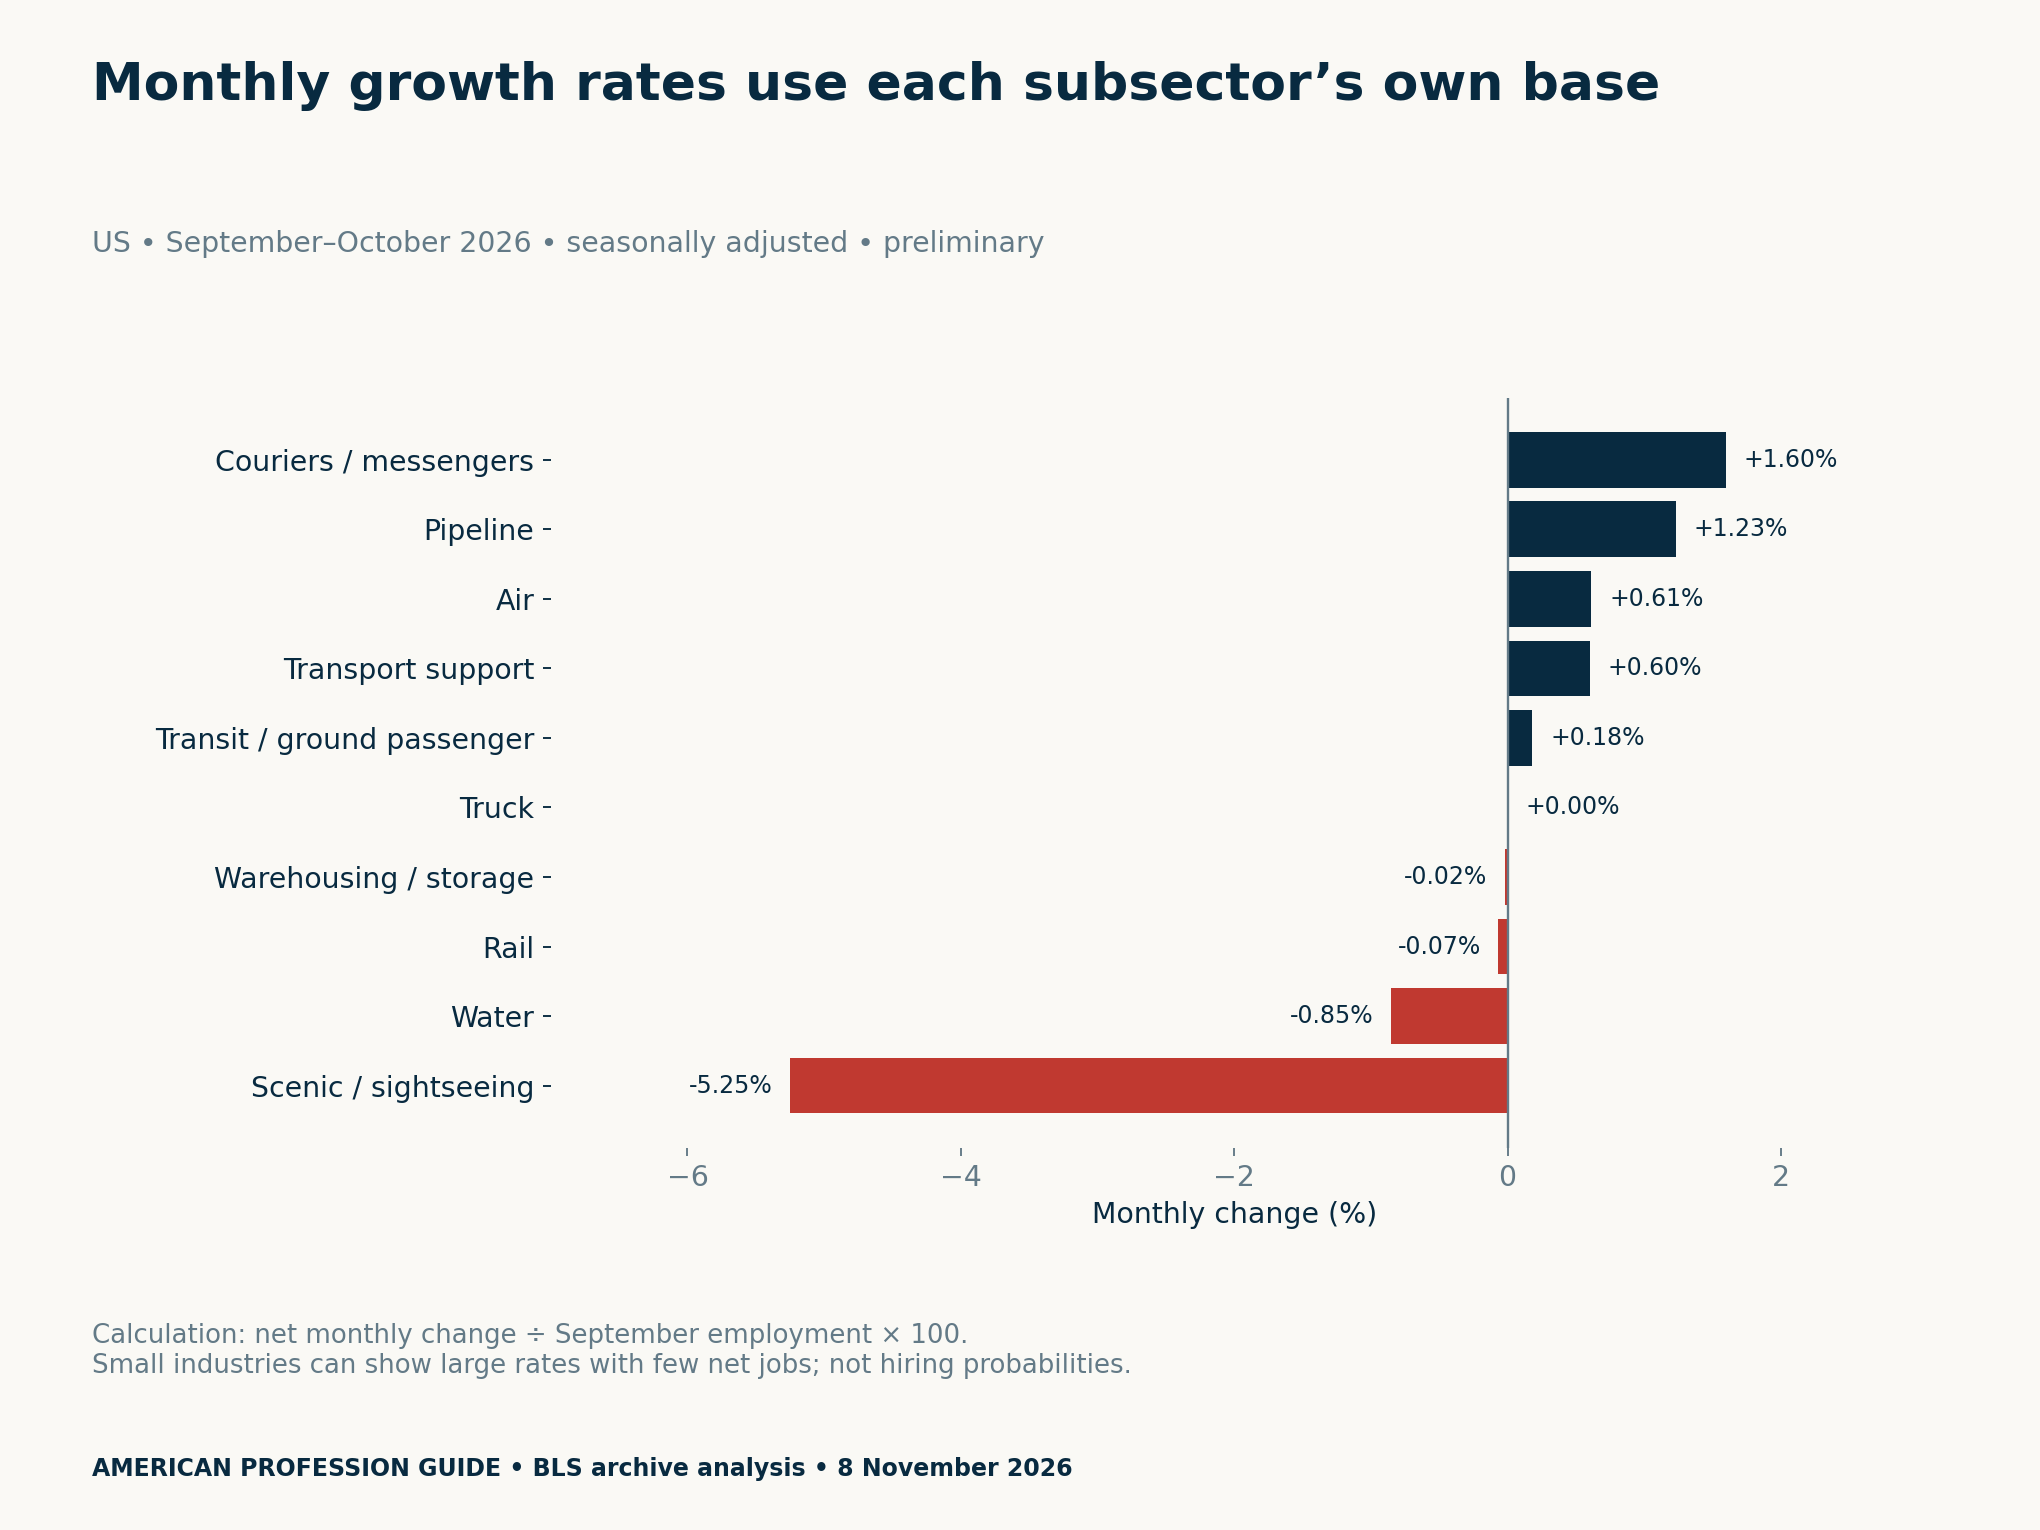
Scenic and sightseeing transportation illustrates the denominator issue: a relatively small industry can show a noticeable percentage movement with a modest absolute job change. Use both the counts and rates. Neither alone determines which occupation or location offers a suitable opportunity.
A short recent path is not a forecast
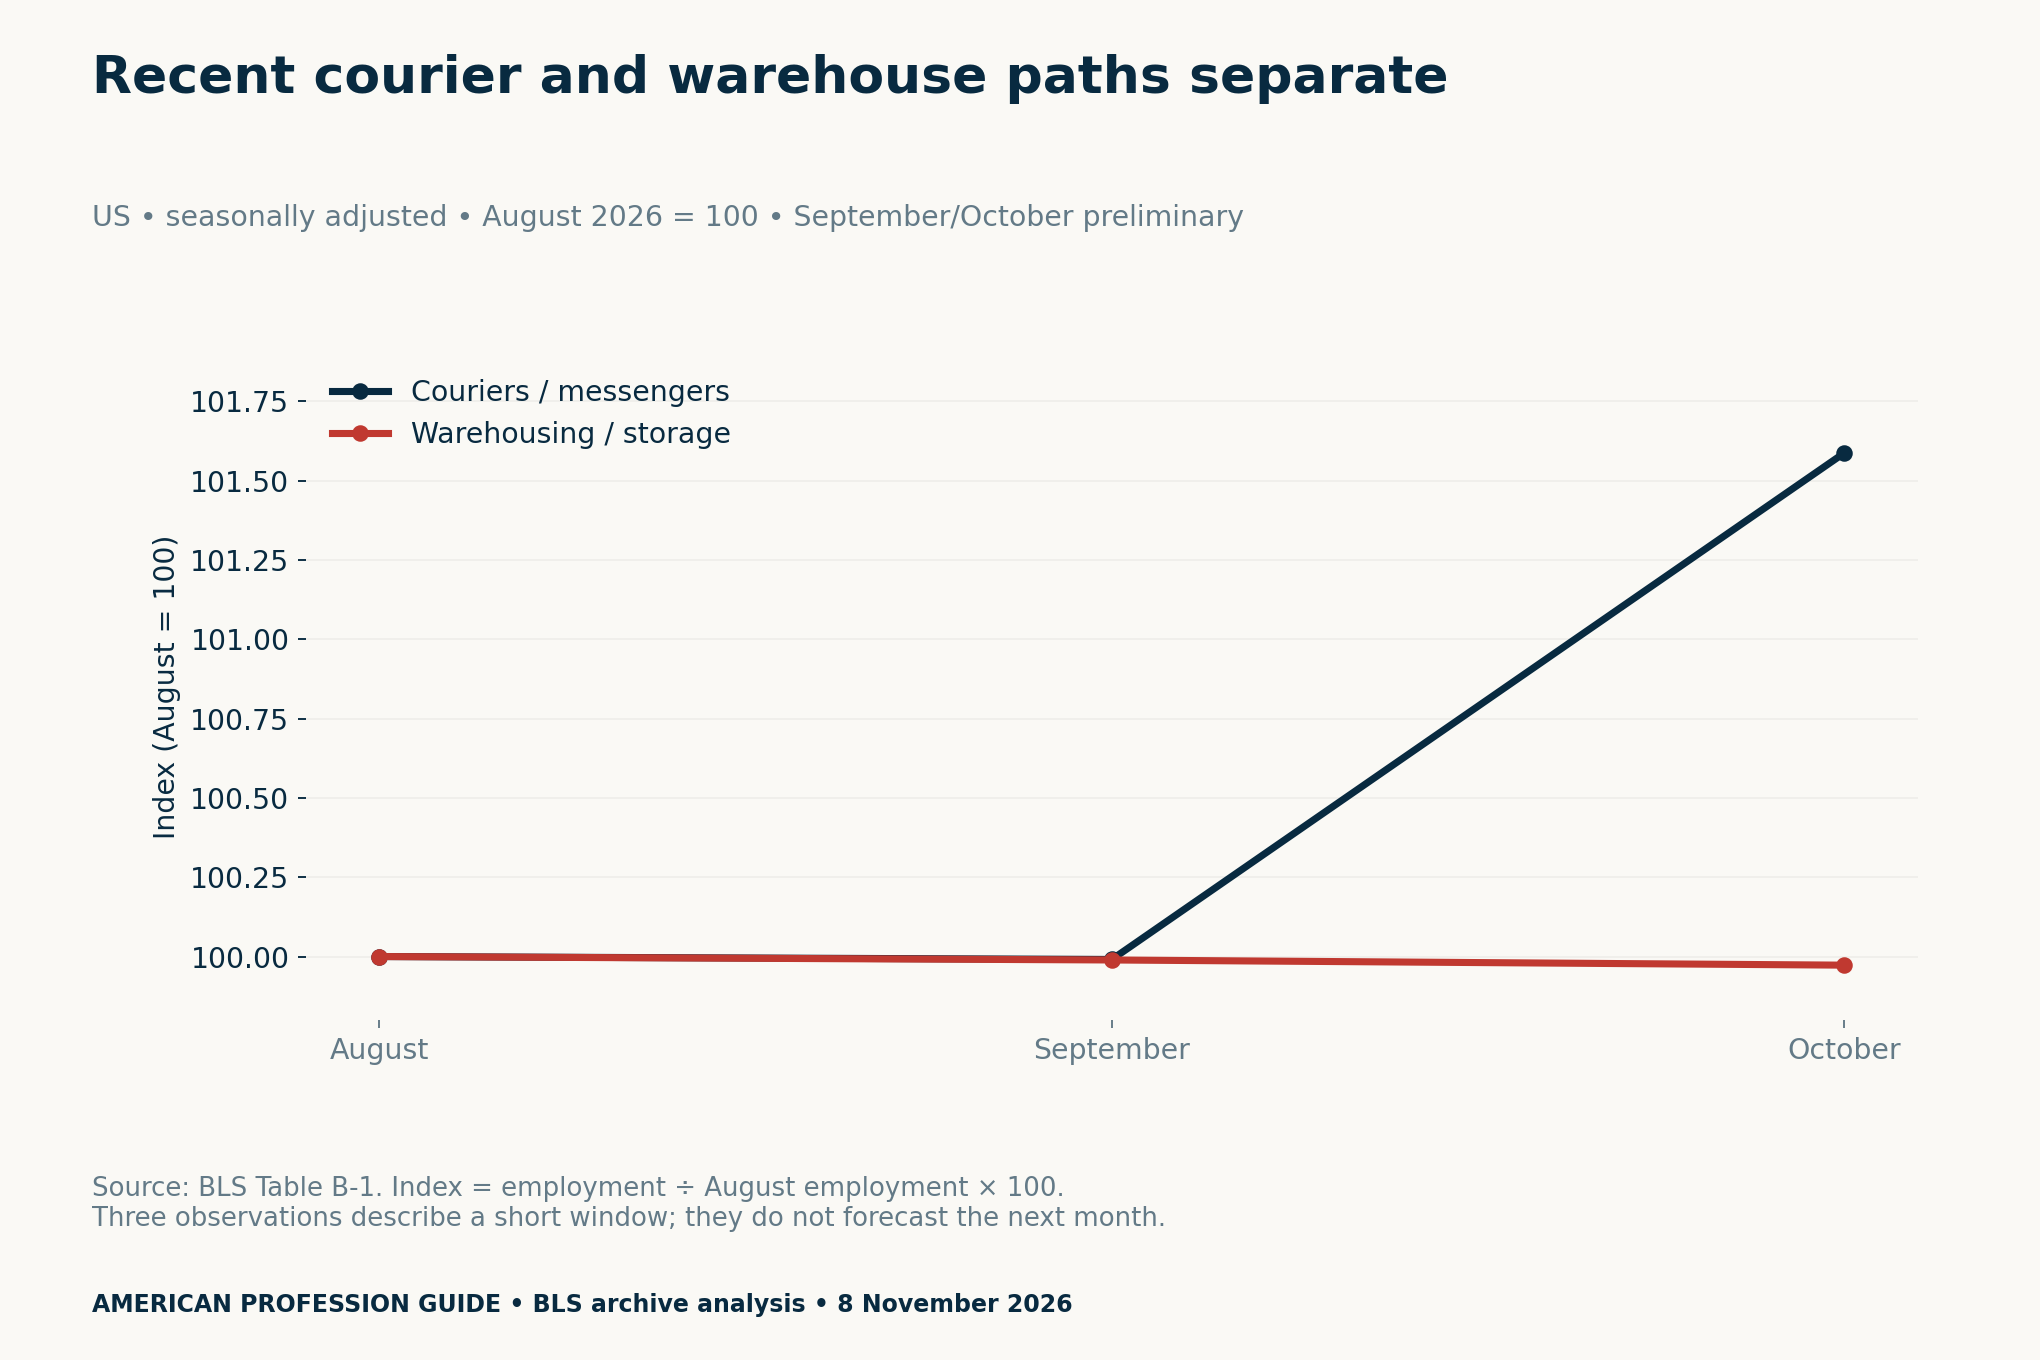
The table provides August, September and October observations on the same release basis. We index each series to its own August level. Three observations describe this window; they cannot establish permanent momentum, explain a particular employer’s plans or predict the next release.
September and October are preliminary in this archived release. BLS revises estimates as reports arrive and seasonal factors are recalculated. Keep the publication date with the figures. A later update should preserve the earlier version and explain revisions instead of silently replacing its numbers.
Why raw and seasonally adjusted changes differ
The raw courier increase is 57,000 jobs, compared with the adjusted 17,400. Warehousing rises by 20,800 in the raw data but falls by 300 after adjustment. Mixing a raw numerator with an adjusted denominator would produce an inconsistent comparison.
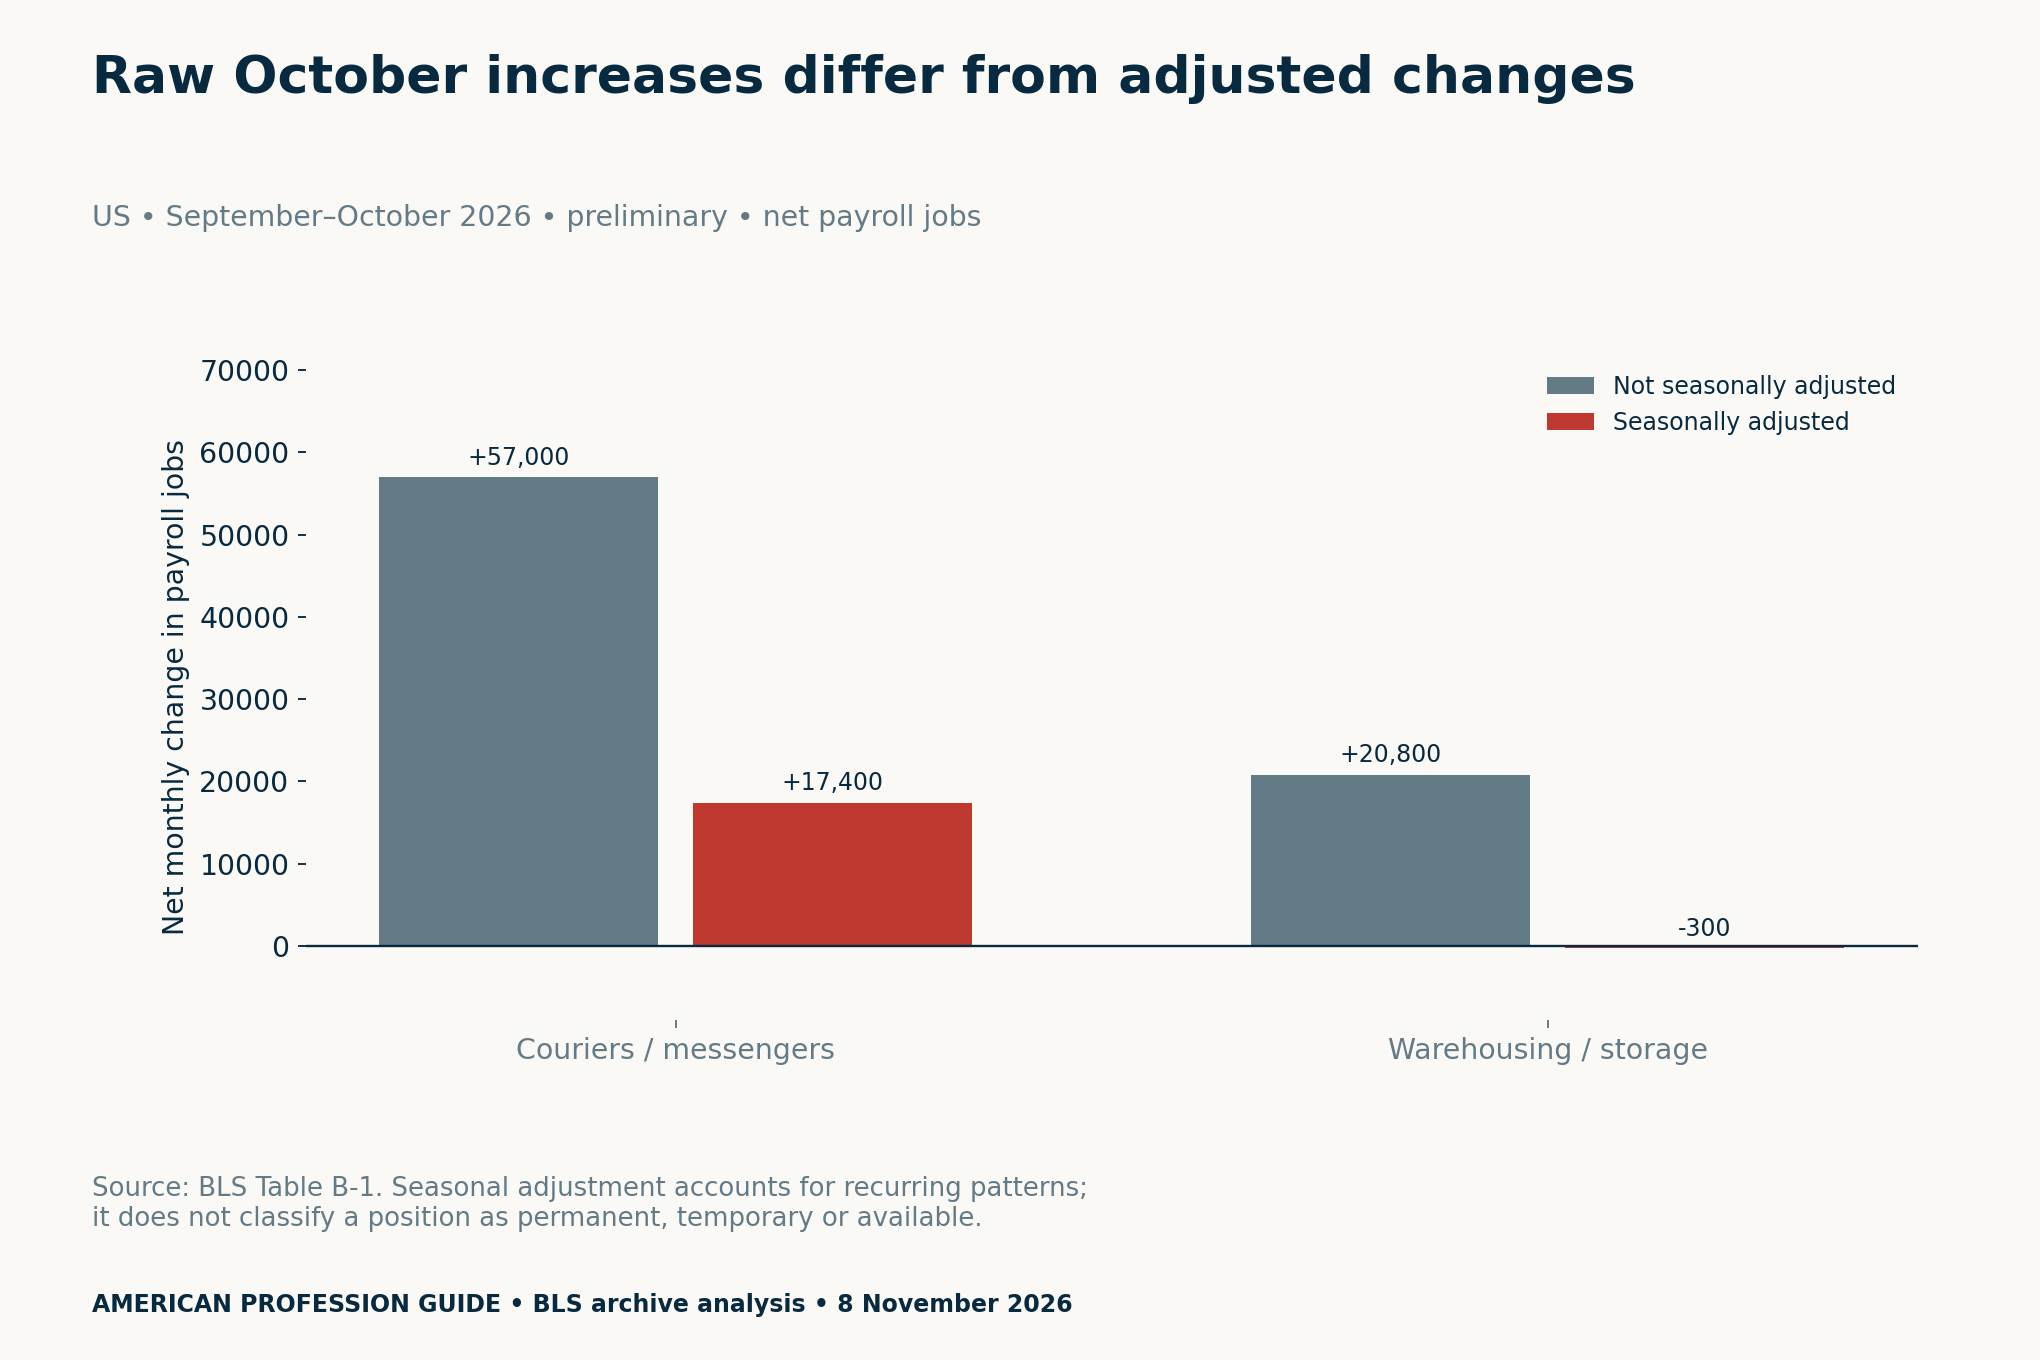
This difference is especially useful when reading a recruitment headline during a seasonal period. It does not prove that a particular position is short term. Employment type, expected duration and working hours need evidence from the actual employer and offer.
Turn the national signal into local questions
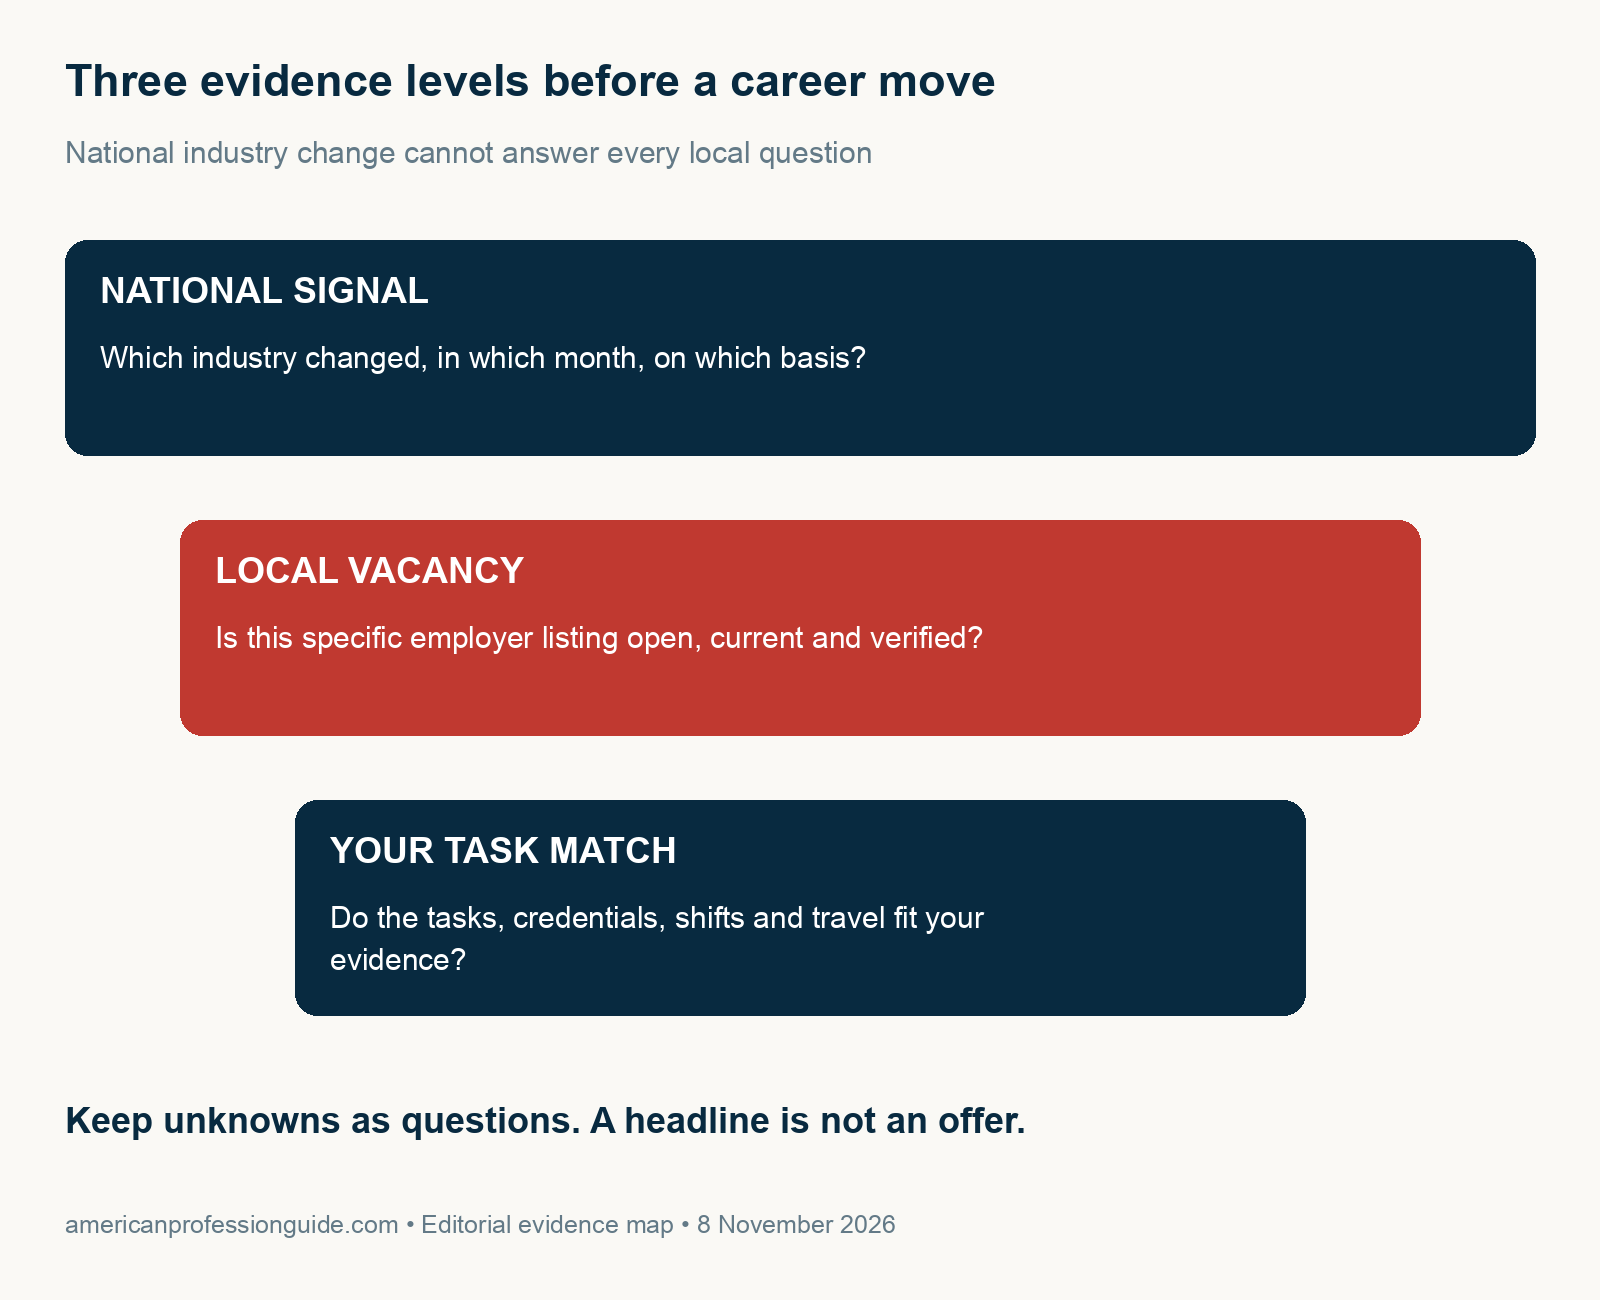
The blank vacancy register has thirty numbered rows as capacity, not thirty collected observations. No local vacancy sample was conducted. For each actual listing, retain the official employer source, requisition ID, location, date checked and status. Link duplicate listings to one original role.
Then compare tasks, handling demands, equipment, required authorisations, shifts and travel with your own evidence. Ask the employer to clarify unknowns. Do not infer a licence requirement from the industry name or assume a warehouse credential transfers to every courier role.
The task matrix deliberately contains no automatic suitability score. A high total could hide one essential unmet requirement. Keep mandatory conditions separate from preferences, and record what is verified, unknown or not applicable. Our temporary-offer checklist can support questions about stated hours and assignment duration.
Download the logistics evidence tools
- Archived B-1 source rows and column basis (CSV)
- Reproducible subsector calculations (CSV)
- Blank local vacancy evidence register (CSV)
- Blank task-transfer questions matrix (CSV)
All files are free and require no login. Source rows retain both seasonal bases. The derived file converts thousands to jobs and calculates rates consistently. The two blank tools collect future evidence; they contain no observed job listings or personal employment assessment.
Methodology and limits
We checked the archived 6 November BLS release on 8 November 2026. Table B-1’s ten transportation detail rows sum exactly to the 24.8-thousand net change. We checked each published change against October minus September levels and kept the sector total separate from the details.
These establishment-survey estimates count payroll jobs, not unique people, open vacancies, gross hires or unincorporated self-employed gig work. Industries contain multiple occupations. Seasonal adjustment is not a guarantee of stability. No sampling-error test, causal claim or individual career forecast is made here.
For a different evidence trail, our fictional work-record guide shows why activity records and financial arrangements answer separate questions. The same discipline matters here: courier vs warehouse job growth is a national signal to investigate, not a substitute for verifying a local role.


