







U.S. job growth tells only part of the story when you compare careers. A small occupation can expand quickly yet offer few openings. Meanwhile, a much larger occupation can shrink and still need hundreds of thousands of new entrants each year.
American Profession Guide analyzed 831 detailed occupations in the latest Bureau of Labor Statistics projections. We compared percentage growth, annual openings, and historical median wages. The ten fastest-growing occupations and the ten with the most annual openings have no overlap.
2026 research edition. The projections cover 2025–2035 and were released on August 27, 2026. Wage figures refer to 2025. We analyzed the data on October 19, 2026. Neither the projected openings nor the pay figures describe vacancies or starting salaries available today.
Explore the key findings, job growth rankings, openings rankings, and methodology. You can also download all 831 occupation records.
Five findings from the U.S. job growth data
- Speed and scale produce different leaders. Nurse practitioners lead projected growth at 41.0%. Fast food and counter workers lead annual openings at 827,400.
- The ten largest-opening occupations offer 26.2 times as many openings. Their combined annual total is 4,720,400, versus 180,500 for the ten fastest-growing occupations.
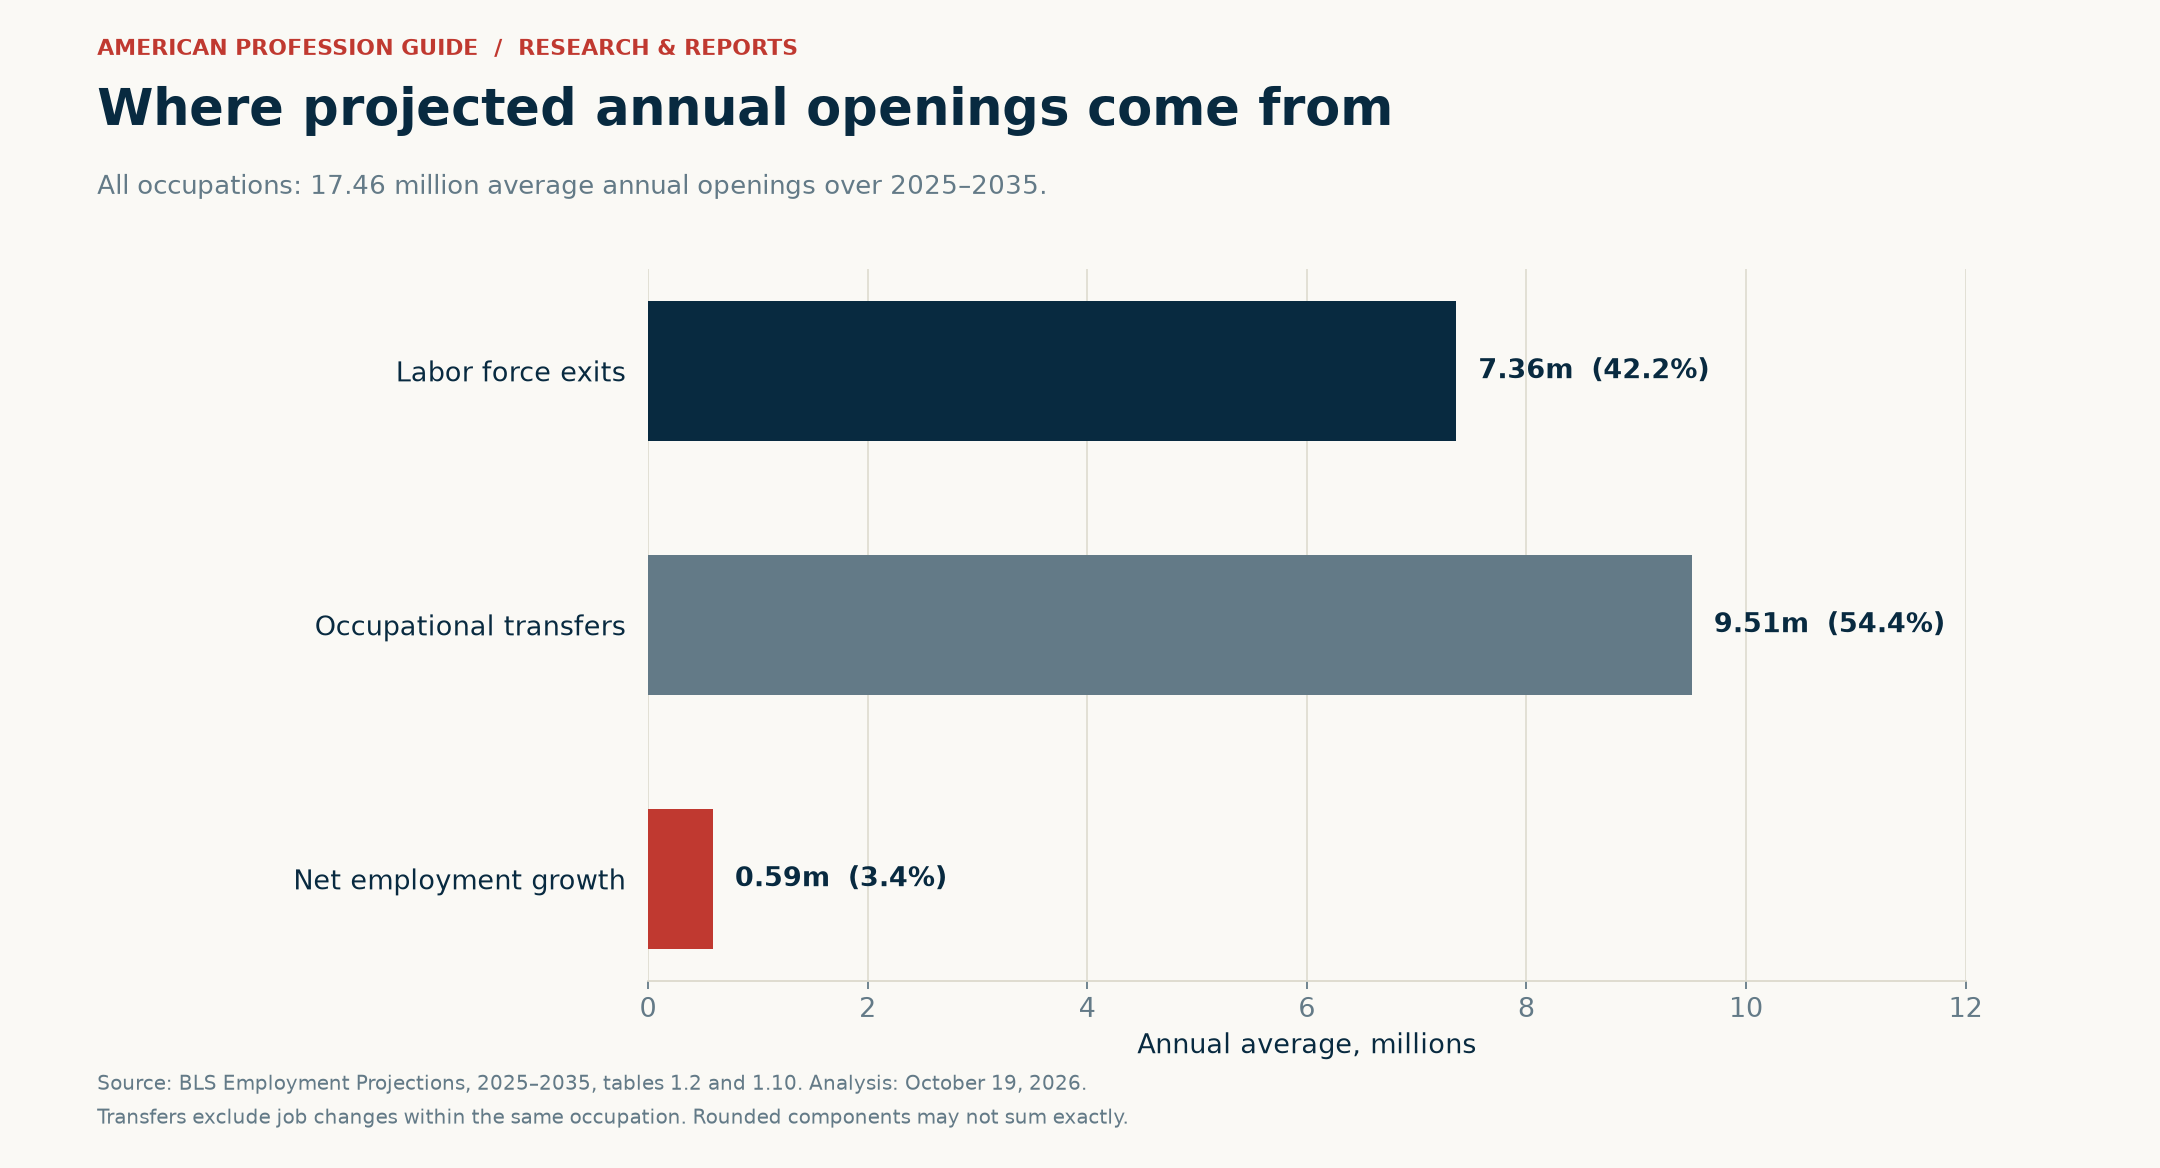
- Most openings come from workers leaving occupations. Labor force exits and occupational transfers account for about 96.6% of the national annual total. Net employment growth contributes about 3.4%.
- Declining occupations still account for 4.34 million annual openings. That is about 24.9% of all projected openings, despite their falling employment totals.
- High growth does not imply high pay. Annual median wages among the ten growth leaders range from $45,130 to $140,300. These are 2025 wage benchmarks.
Across the full dataset, 591 occupations have positive projected growth, 232 have negative growth, and eight show no change. These counts use the published rates, rounded to one decimal place. In addition, 356 occupations grow faster than the all-occupation benchmark of 3.5%.
What job growth and annual openings actually measure
The BLS definitions distinguish employment change from occupational openings. Growth measures the net change in jobs between the start and end of the decade. Openings include that change plus the need to replace workers who leave an occupation.
| Measure | What it answers | What it does not tell you |
|---|---|---|
| Percentage growth | How fast is employment projected to change from 2025 to 2035? | How many vacancies exist today |
| Numeric growth | How many net jobs does the occupation gain or lose over the decade? | All hiring during the decade |
| Annual openings | How many openings arise each year on average from growth and separations? | A count of current job advertisements |
| Annual median wage | What was the midpoint of measured wages in 2025? | A starting salary or projected 2035 wage |
For example, a career can grow from a small base and achieve an impressive percentage gain. However, that gain may translate into relatively few jobs. A mature occupation can have a low growth rate but many openings because its workforce is large. Therefore, consider both measures before choosing a training path.
Job growth rankings: the ten fastest-growing occupations
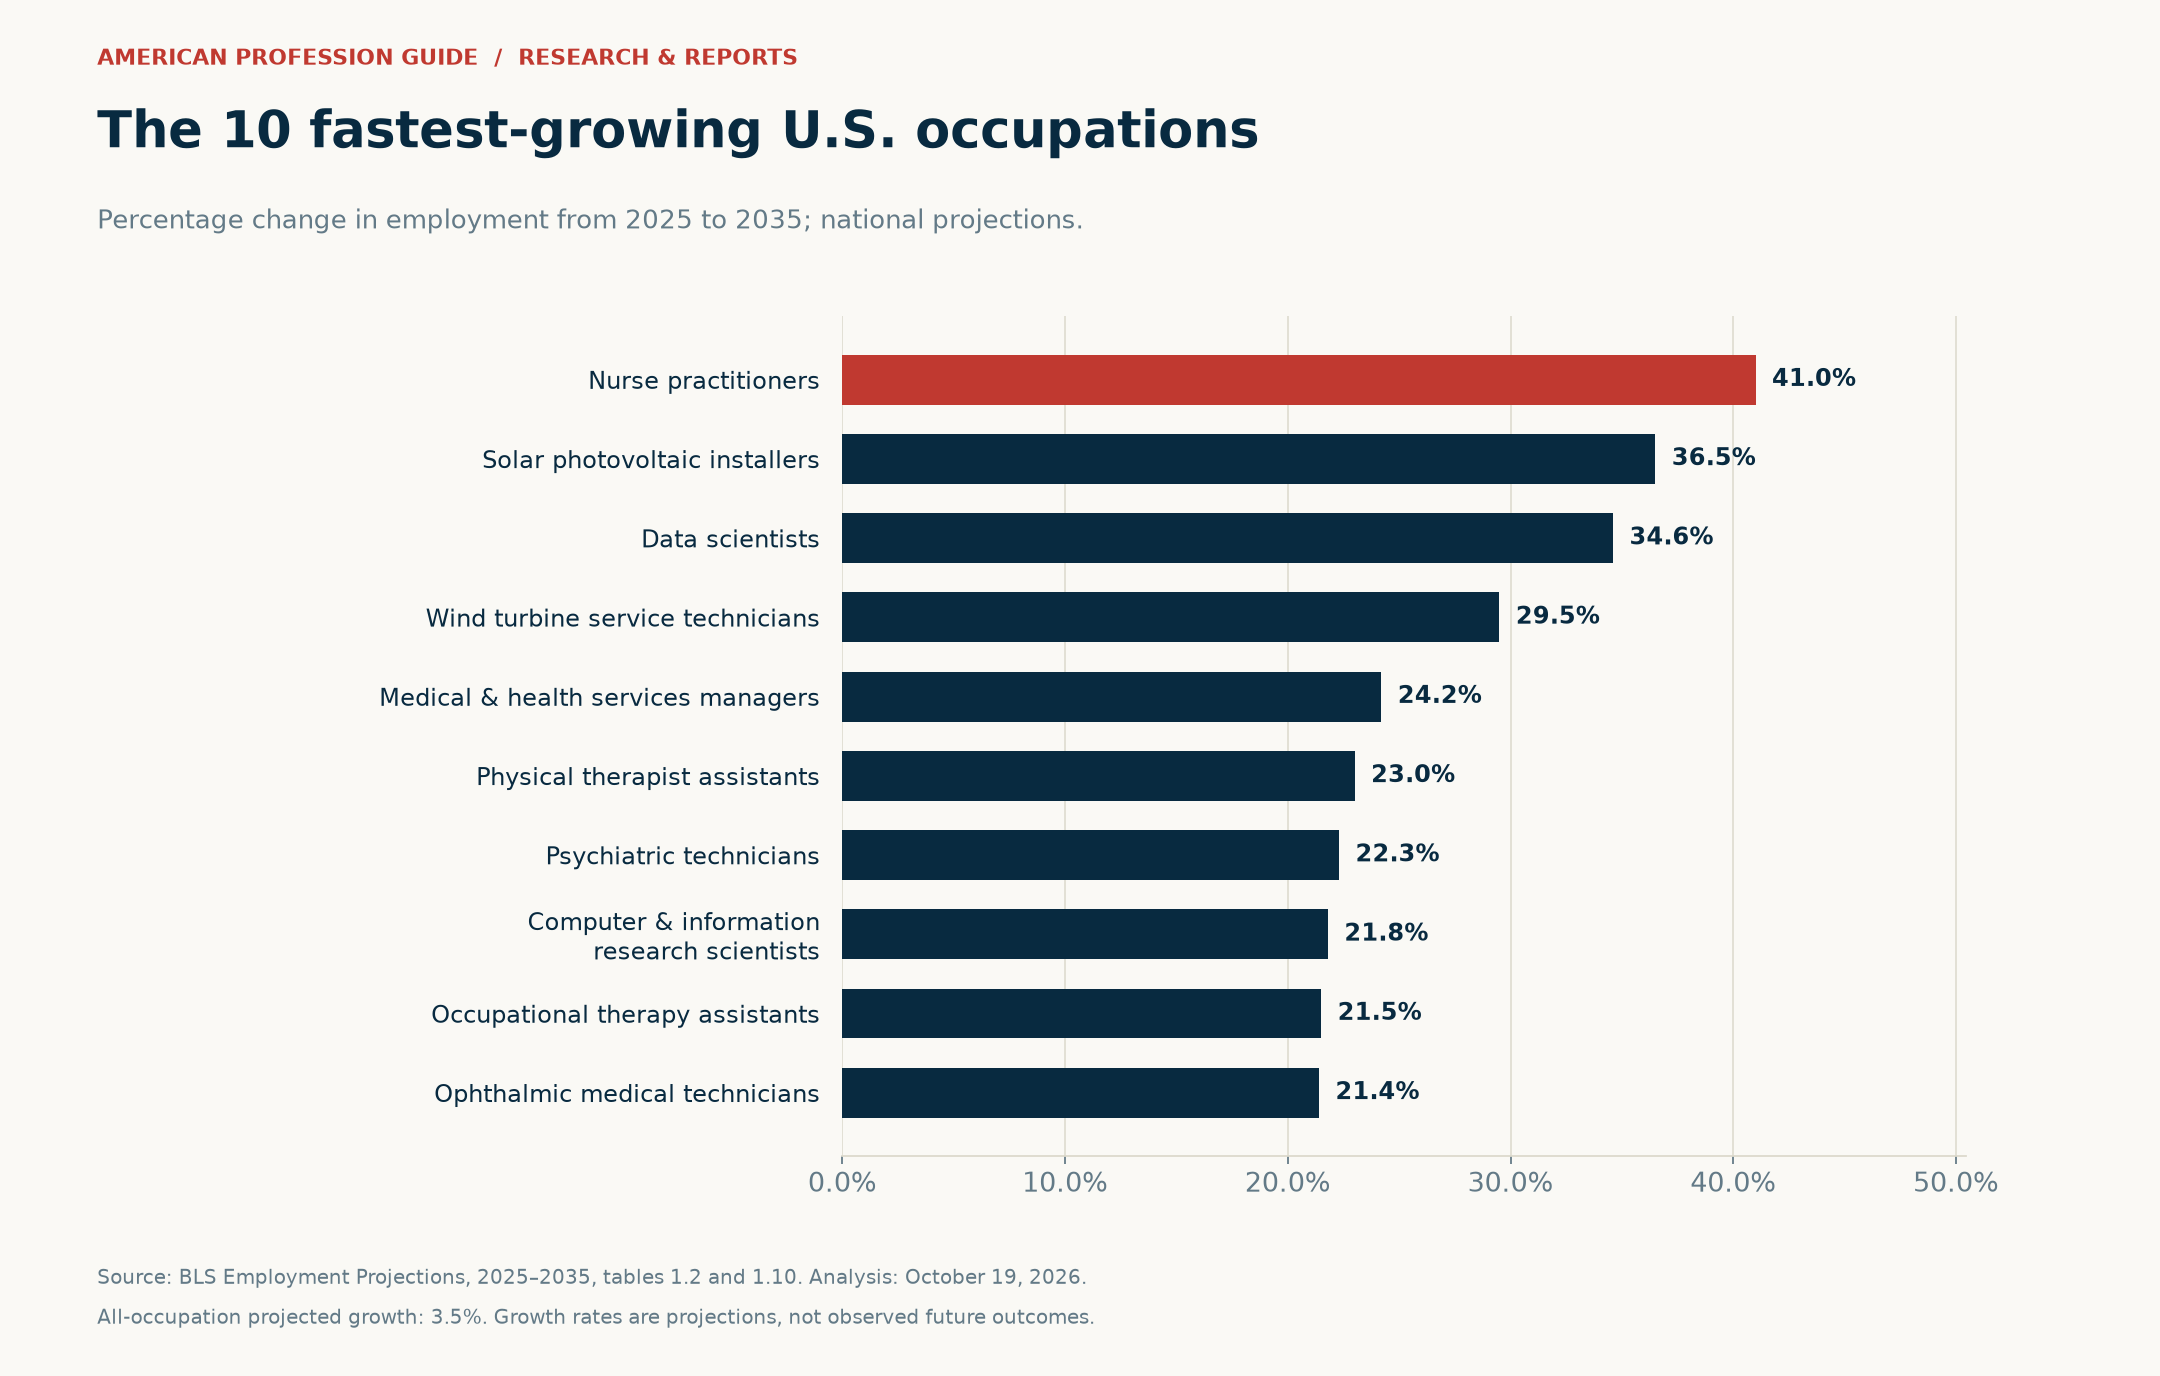
Nurse practitioners lead the 2025–2035 ranking with projected growth of 41.0%. Solar photovoltaic installers follow at 36.5%, while data scientists rank third at 34.6%. The ten leaders span health services, technology, and energy-related work.
| Occupation | Growth, 2025–35 | Net jobs added, decade | Annual openings | 2025 median pay |
|---|---|---|---|---|
| Nurse practitioners | 41.0% | 137,800 | 29,400 | $132,300 |
| Solar photovoltaic installers | 36.5% | 11,300 | 4,200 | $53,140 |
| Data scientists | 34.6% | 95,400 | 24,800 | $120,230 |
| Wind turbine service technicians | 29.5% | 3,500 | 1,500 | $64,120 |
| Medical and health services managers | 24.2% | 155,100 | 62,300 | $123,860 |
| Physical therapist assistants | 23.0% | 26,200 | 18,500 | $68,380 |
| Psychiatric technicians | 22.3% | 36,000 | 17,000 | $45,130 |
| Computer and information research scientists | 21.8% | 8,400 | 2,900 | $140,300 |
| Occupational therapy assistants | 21.5% | 11,200 | 8,100 | $72,300 |
| Ophthalmic medical technicians | 21.4% | 15,500 | 11,800 | $45,570 |
The scale difference is substantial. Wind turbine service technicians rank fourth by growth rate, at 29.5%. Yet BLS projects only 1,500 annual openings in that occupation. Medical and health services managers grow at a slower 24.2%, but have 62,300 annual openings—over 41 times as many.
Similarly, solar installers have a higher growth rate than data scientists. However, data scientists have 24,800 annual openings, compared with 4,200 for solar installers. These comparisons do not establish which career suits a person better. Instead, they show why a percentage ranking needs a measure of scale beside it.
Entry education also differs among the growth leaders
The education labels in the source describe the typical preparation needed to enter each occupation. They are useful starting points. However, employers, licensing authorities, and individual training programs may set additional requirements. The labels also do not mean every current worker has that exact qualification.
| Typical entry education in BLS | Occupations in the top ten |
|---|---|
| Master’s degree | Nurse practitioners; computer and information research scientists |
| Bachelor’s degree | Data scientists; medical and health services managers |
| Associate’s degree | Physical therapist assistants; occupational therapy assistants |
| Postsecondary nondegree award | Wind turbine service technicians; psychiatric technicians; ophthalmic medical technicians |
| High school diploma or equivalent | Solar photovoltaic installers |
For a closer look at a particular route, use the source workbook’s links to the Occupational Outlook Handbook. Compare the duties, work environment, education, experience, and training sections. That gives a more complete picture than growth alone.
Annual openings rankings: where the largest numbers are
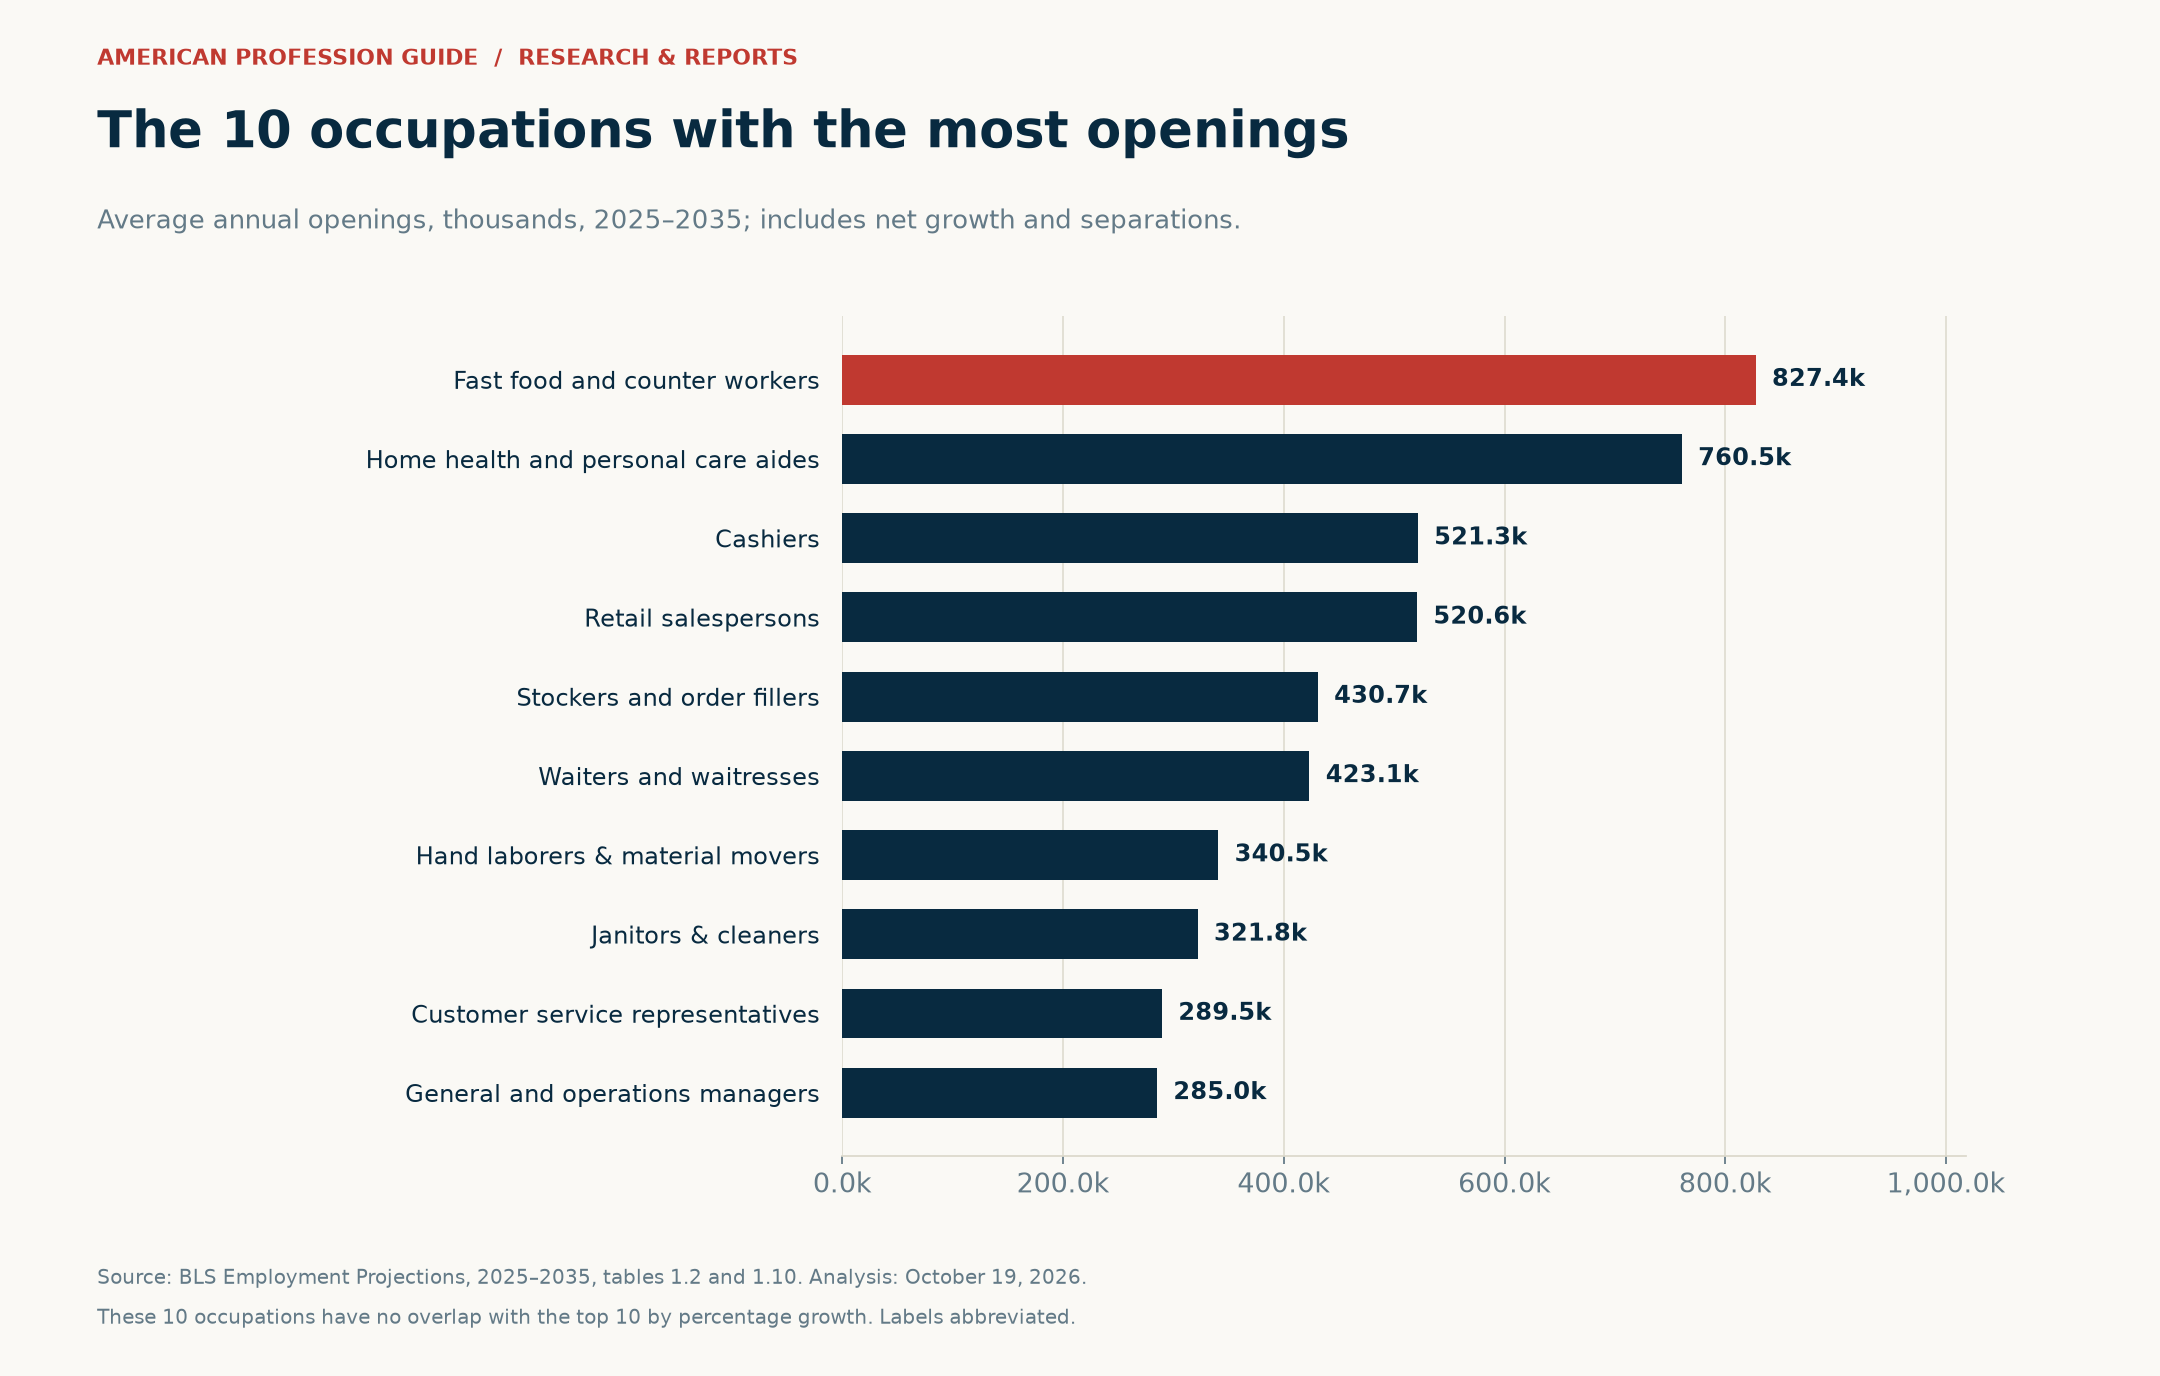
Fast food and counter workers have the largest annual-opening estimate, at 827,400. Home health and personal care aides follow at 760,500. Cashiers and retail salespersons each have more than 520,000 openings a year, even though both have negative projected job growth.
| Occupation | Annual openings | Growth, 2025–35 | 2025 median pay |
|---|---|---|---|
| Fast food and counter workers | 827,400 | 5.8% | $31,200 |
| Home health and personal care aides | 760,500 | 18.1% | $35,800 |
| Cashiers | 521,300 | -6.5% | $32,880 |
| Retail salespersons | 520,600 | -0.3% | $35,410 |
| Stockers and order fillers | 430,700 | 8.9% | $37,330 |
| Waiters and waitresses | 423,100 | 2.0% | $35,230 |
| Laborers and freight, stock, and material movers, hand | 340,500 | 1.8% | $40,240 |
| Janitors and cleaners, except maids and housekeeping cleaners | 321,800 | 2.2% | $36,840 |
| Customer service representatives | 289,500 | -5.3% | $44,770 |
| General and operations managers | 285,000 | 5.0% | $105,770 |
Together, these ten occupations account for 4.72 million annual openings, or about 27.0% of the national total. By comparison, the ten fastest-growing occupations account for 180,500 openings. Their combined share is roughly 1.0%. Thus, the two lists describe very different parts of the labor market.
A large opening count is not a job-quality score. Pay, hours, scheduling, safety, and advancement all matter. Nine of the ten largest-opening occupations have annual median wages below $45,000 in this dataset. General and operations managers are the exception, at $105,770.
Nor does the ranking measure how many applicants compete for each opening. It contains no applicant counts, local vacancy data, or employer hiring standards. For that reason, use it to understand national scale before checking actual opportunities in your area.
Why 96.6% of openings come from separations
BLS projects 17,461,800 annual openings across all occupations. Yet its projected net employment increase is 5,917,600 jobs over the entire decade. Spread across ten years, that gain is about 591,760 jobs a year. The much larger remaining component comes from separations.
| Component | Average annual amount | Share of annual openings |
|---|---|---|
| Labor force exits | 7,362,400 | 42.2% |
| Occupational transfers | 9,507,600 | 54.4% |
| Net employment growth | 591,760 | 3.4% |
| All annual openings | 17,461,800 | 100.0% |
An occupational transfer means a worker leaves one occupation for another. Changing employers while remaining in the same occupation does not count. Meanwhile, labor force exits include more than retirement. They can include people who leave work for education or other reasons.
These are modeled flows, based on the BLS occupational separations methodology. They are not a direct tally of every resignation or advertised vacancy. Also, the annual figures are averages over the projection period. They do not imply that hiring will be identical in every year.
Negative job growth does not mean zero openings
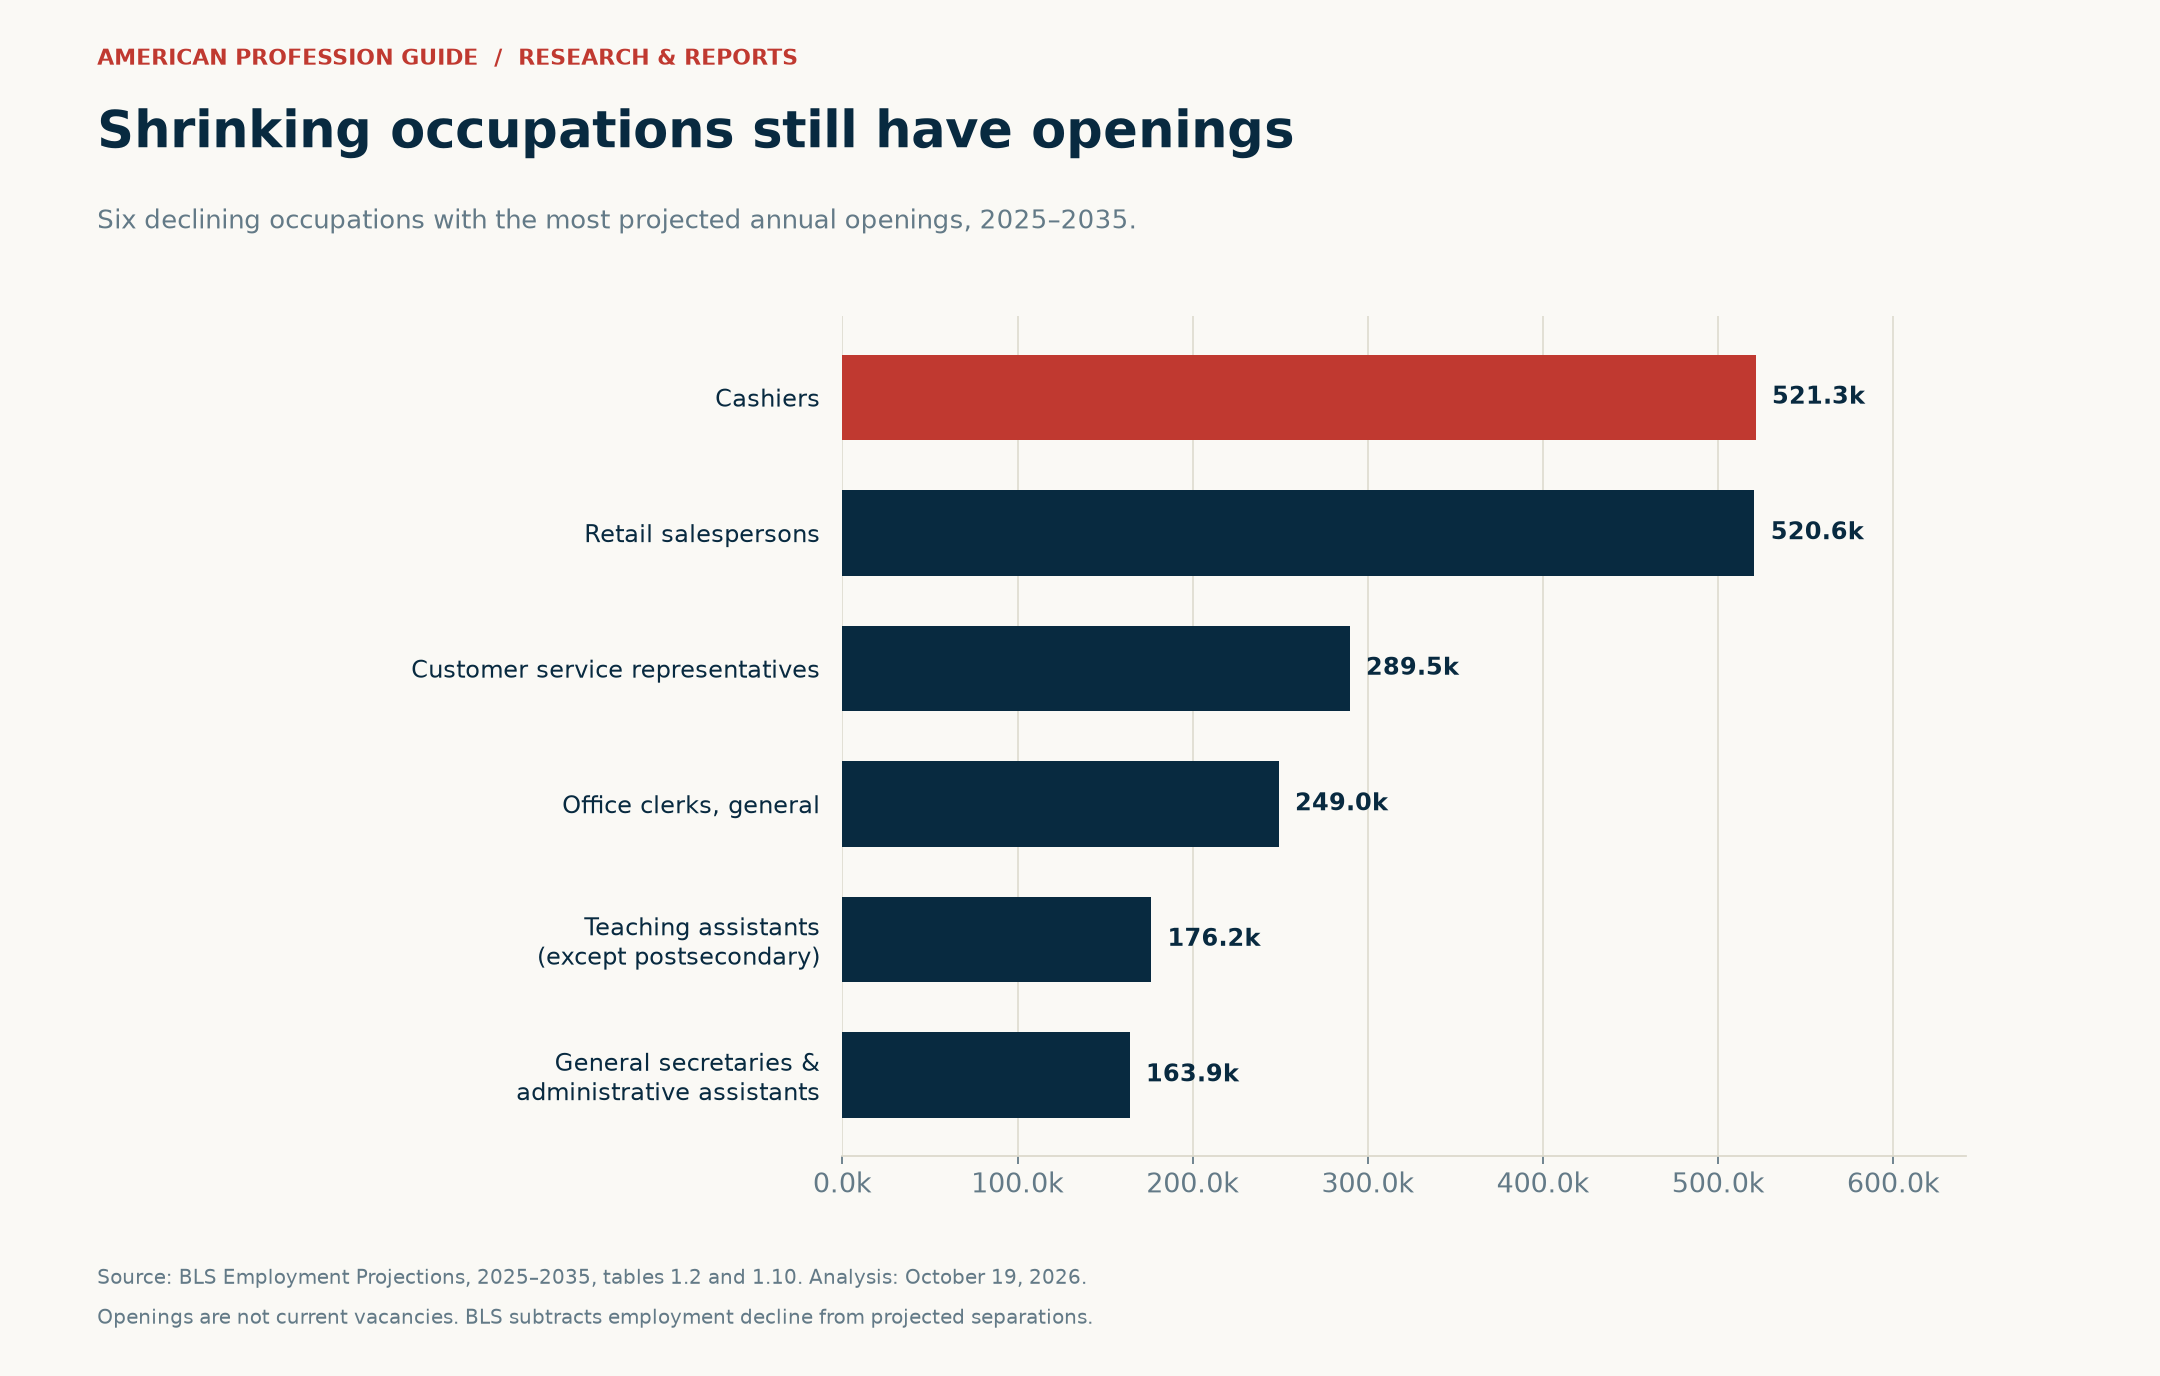
The 232 occupations with declining employment still account for 4,344,600 projected annual openings. Cashiers provide the clearest large-scale example. Their employment falls 6.5% over the decade, yet BLS projects 521,300 annual openings as workers leave the occupation.
| Declining occupation | Growth, 2025–35 | Annual openings |
|---|---|---|
| Cashiers | -6.5% | 521,300 |
| Retail salespersons | -0.3% | 520,600 |
| Customer service representatives | -5.3% | 289,500 |
| Office clerks, general | -6.0% | 249,000 |
| Teaching assistants, except postsecondary | -0.3% | 176,200 |
| Secretaries and administrative assistants, except legal, medical, and executive | -6.0% | 163,900 |
This distinction matters for both workers and training providers. A shrinking occupation may still offer near-term routes into employment. However, its long-term employment trend can create challenges for advancement or future job searches. The data support considering both sides of that decision.
Conversely, a high growth rate cannot guarantee an individual job. Openings may cluster in certain regions, require prior experience, or depend on specialized credentials. A national projection does not show whether those conditions match your circumstances.
Fast job growth does not guarantee a six-figure salary
The ten growth leaders show a wide pay range. Computer and information research scientists have a 2025 annual median of $140,300. Psychiatric technicians have a median of $45,130. The difference is $95,170, despite both occupations appearing in the same top-ten growth list.
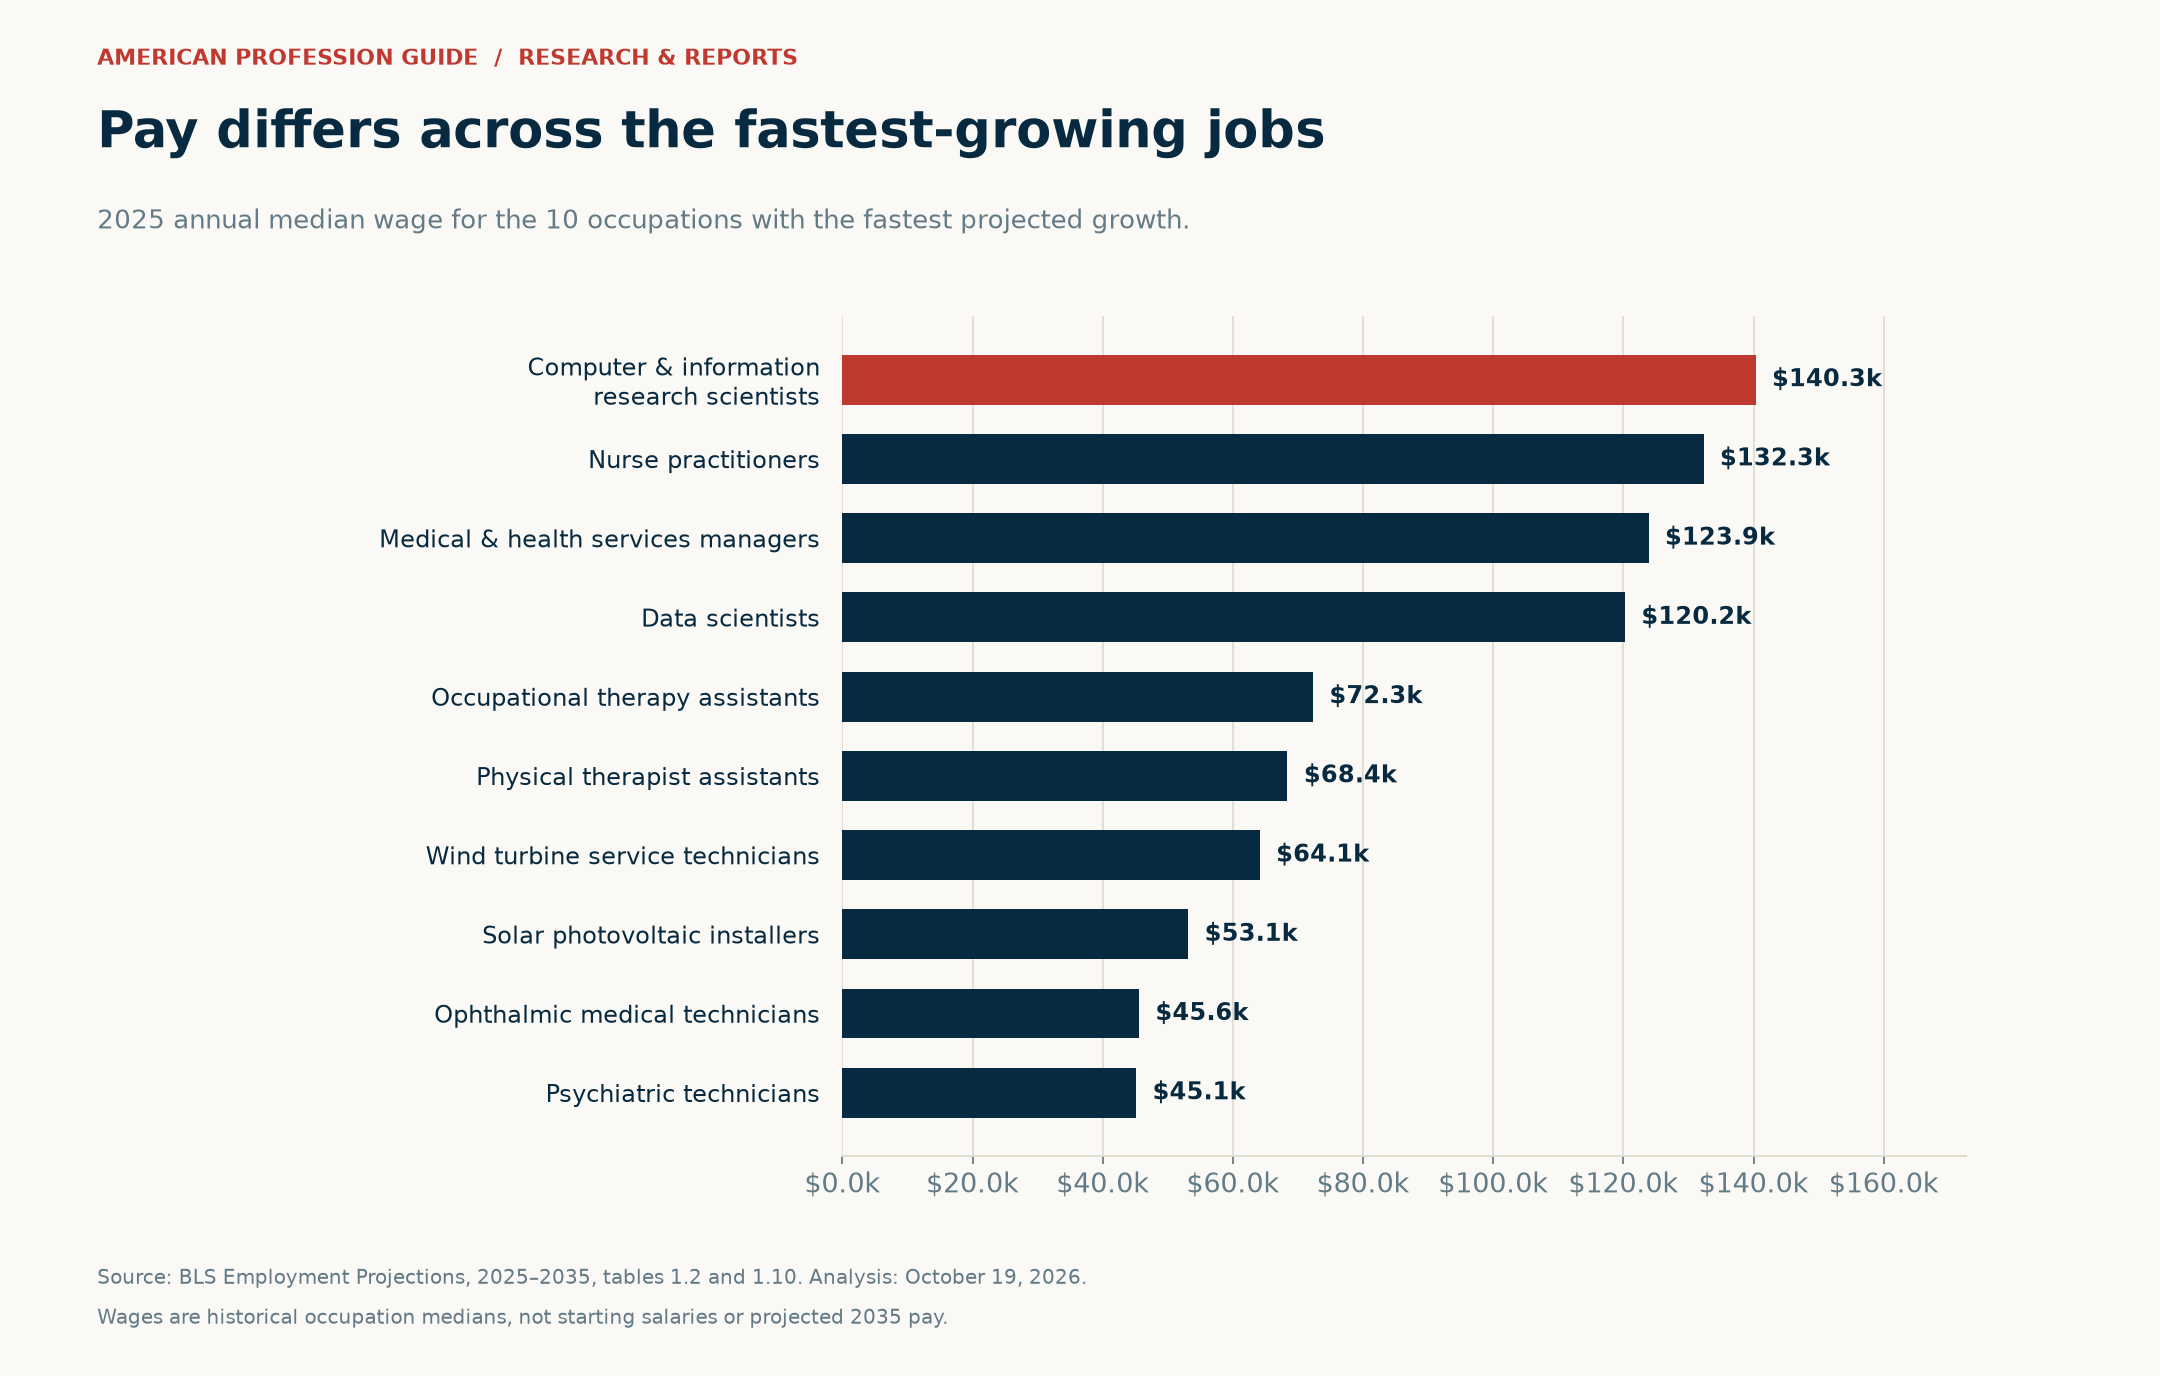
Four of the ten occupations have medians above $120,000. The other six range from $45,130 to $72,300. Therefore, a claim that all fast-growing careers offer high pay would misrepresent the data. Education, responsibilities, and the work itself differ sharply across the list.
Median means the midpoint of the measured wage distribution. It is not an entry-level offer or the average salary of new graduates. Moreover, the wage series covers nonfarm wage and salary workers. It excludes self-employed workers and certain other groups described in the source notes.
Location changes the interpretation too. A national wage benchmark does not tell you how far a paycheck goes in a particular city. Our salary purchasing power study compares wages with regional prices for six professions. Use that as a separate location lens, while keeping each study’s data years in mind.
How to use these rankings in a career decision

Start with work you could see yourself doing, then test the practical route into it. The rankings can help you compare broad opportunities. They work best alongside local evidence and a realistic view of your time, finances, and existing skills.
- Check growth and scale together. Compare the percentage trend with annual openings. Neither measure alone gives a full view of demand.
- Read the entry requirements. Look beyond the degree label to experience, training, licensing, and employer expectations.
- Inspect local opportunities. Review relevant employers and current vacancies in the places where you can work.
- Compare realistic pay. Check offers for your experience level, then account for hours, benefits, and living costs.
- Assess the training commitment. Consider fees, time out of paid work, completion requirements, and whether the program fits your intended occupation.
For example, a person choosing between energy and healthcare work should compare daily tasks as well as the growth figures. Someone already trained in computing may face a different transition cost from a first-time student. Consequently, the same ranking can support different choices for different readers.
Methodology: how we ranked 831 occupations
We downloaded the BLS occupational projections workbook through the official occupational data page. Table 1.2 provides employment, growth, annual openings, wages, and entry preparation. Table 1.10 provides labor force exits, occupational transfers, and separations.
- Coverage: We retained the 831 rows marked “Line item” in table 1.2. We excluded summary groups to avoid mixing broad categories with detailed occupations.
- Matching: We joined the detailed rows in table 1.10 by occupation code, with one record per code.
- Rankings: We ranked percentage growth and annual openings separately, from highest to lowest. Ties share the minimum rank in the downloadable file. Occupation code provides a stable display order for tied values.
- Units: Employment and opening estimates in the workbook are in thousands. We multiplied them by 1,000 for the article’s counts.
- Components: We divided the published decade employment change by ten to estimate annual net growth. We used the official all-occupation totals for national shares.
- Missing values and rounding: We retained unavailable wages as missing. We used the published precision and did not create extra accuracy from rounded source values.
The no-overlap finding compares the occupation codes in the two top-ten lists. The 26.2 ratio divides 4,720,400 by 180,500. The declining-occupation share divides 4,344,600 by the national total of 17,461,800. All three calculations use the published figures.
Limits and interpretation
These projections describe a modeled national path through 2035. Economic conditions, technology, policy, and business decisions can produce different outcomes. The BLS release explains the broader assumptions and economic context. We do not interpret any occupation as immune to change.
The employment matrix and wage series also have different coverage. In particular, employment can include self-employed jobs while the reported wage estimates exclude self-employed workers. Thus, the median wage is not a complete earnings measure for every job counted in the employment projection.
Small differences between published totals and sums can result from rounding. We do not claim that close rankings imply meaningful differences in a person’s prospects. Finally, these national results do not replace state projections, local labor-market research, or a specific employer’s requirements.
Download the data and cite this research
Download the 831-occupation job growth dataset (CSV). It includes source occupation codes, employment, growth, openings, wages, entry education, separations, rankings, and links to the relevant Handbook profiles.
Suggested citation: American Profession Guide. “U.S. Job Growth Through 2035: 831 Careers Ranked by Growth, Openings and Pay.” October 19, 2026. Analysis of BLS Employment Projections, 2025–2035, tables 1.2 and 1.10.
Journalists, educators, and career advisers may reference the findings and charts with attribution and a link to this article. Cite BLS as the underlying data source and American Profession Guide for the analysis. Please keep the projection period and wage year alongside reused figures.
Visuals: The five charts use the published BLS data and APG calculations described above. The featured and career-planning images are AI-generated editorial illustrations. They do not depict actual study participants or supply statistical evidence.