







Salary purchasing power can change how you compare job offers across the United States. A larger paycheck may come with higher prices. Yet a costly city can still offer more buying power when local wages are high enough.
American Profession Guide analyzed 1,042 occupation–metro comparisons across 330 metropolitan areas. We matched federal wage estimates with regional price data for six professions. The result is a set of transparent rankings that shows where each profession’s median wage goes furthest.
2026 edition; 2024 data. We use May 2024 wages and 2024 regional prices, the latest common year available in the two source series as of October 19, 2026. Newer May 2025 wage estimates exist. However, using 2024 for both inputs keeps this comparison on a shared time basis. These are historical estimates, not forecasts of 2026 salaries.
Jump to key findings, profession rankings, methodology, or downloadable data.
Key findings: where salary purchasing power is strongest
- San Jose leads four of six professions. It ranks first for registered nurses, software developers, accountants and auditors, and human resources specialists after the price adjustment.
- Portland leads for electricians. Its adjusted median wage is $96,821. Chicago follows at $96,086 among the 117 eligible electrician markets.
- Visalia leads for elementary school teachers. Its published median wage of $101,340 becomes $101,518 at the national average price level.
- Some smaller markets move up sharply. Merced moves from 15th to second for elementary teachers. Davenport moves from 22nd to fourth for HR specialists.
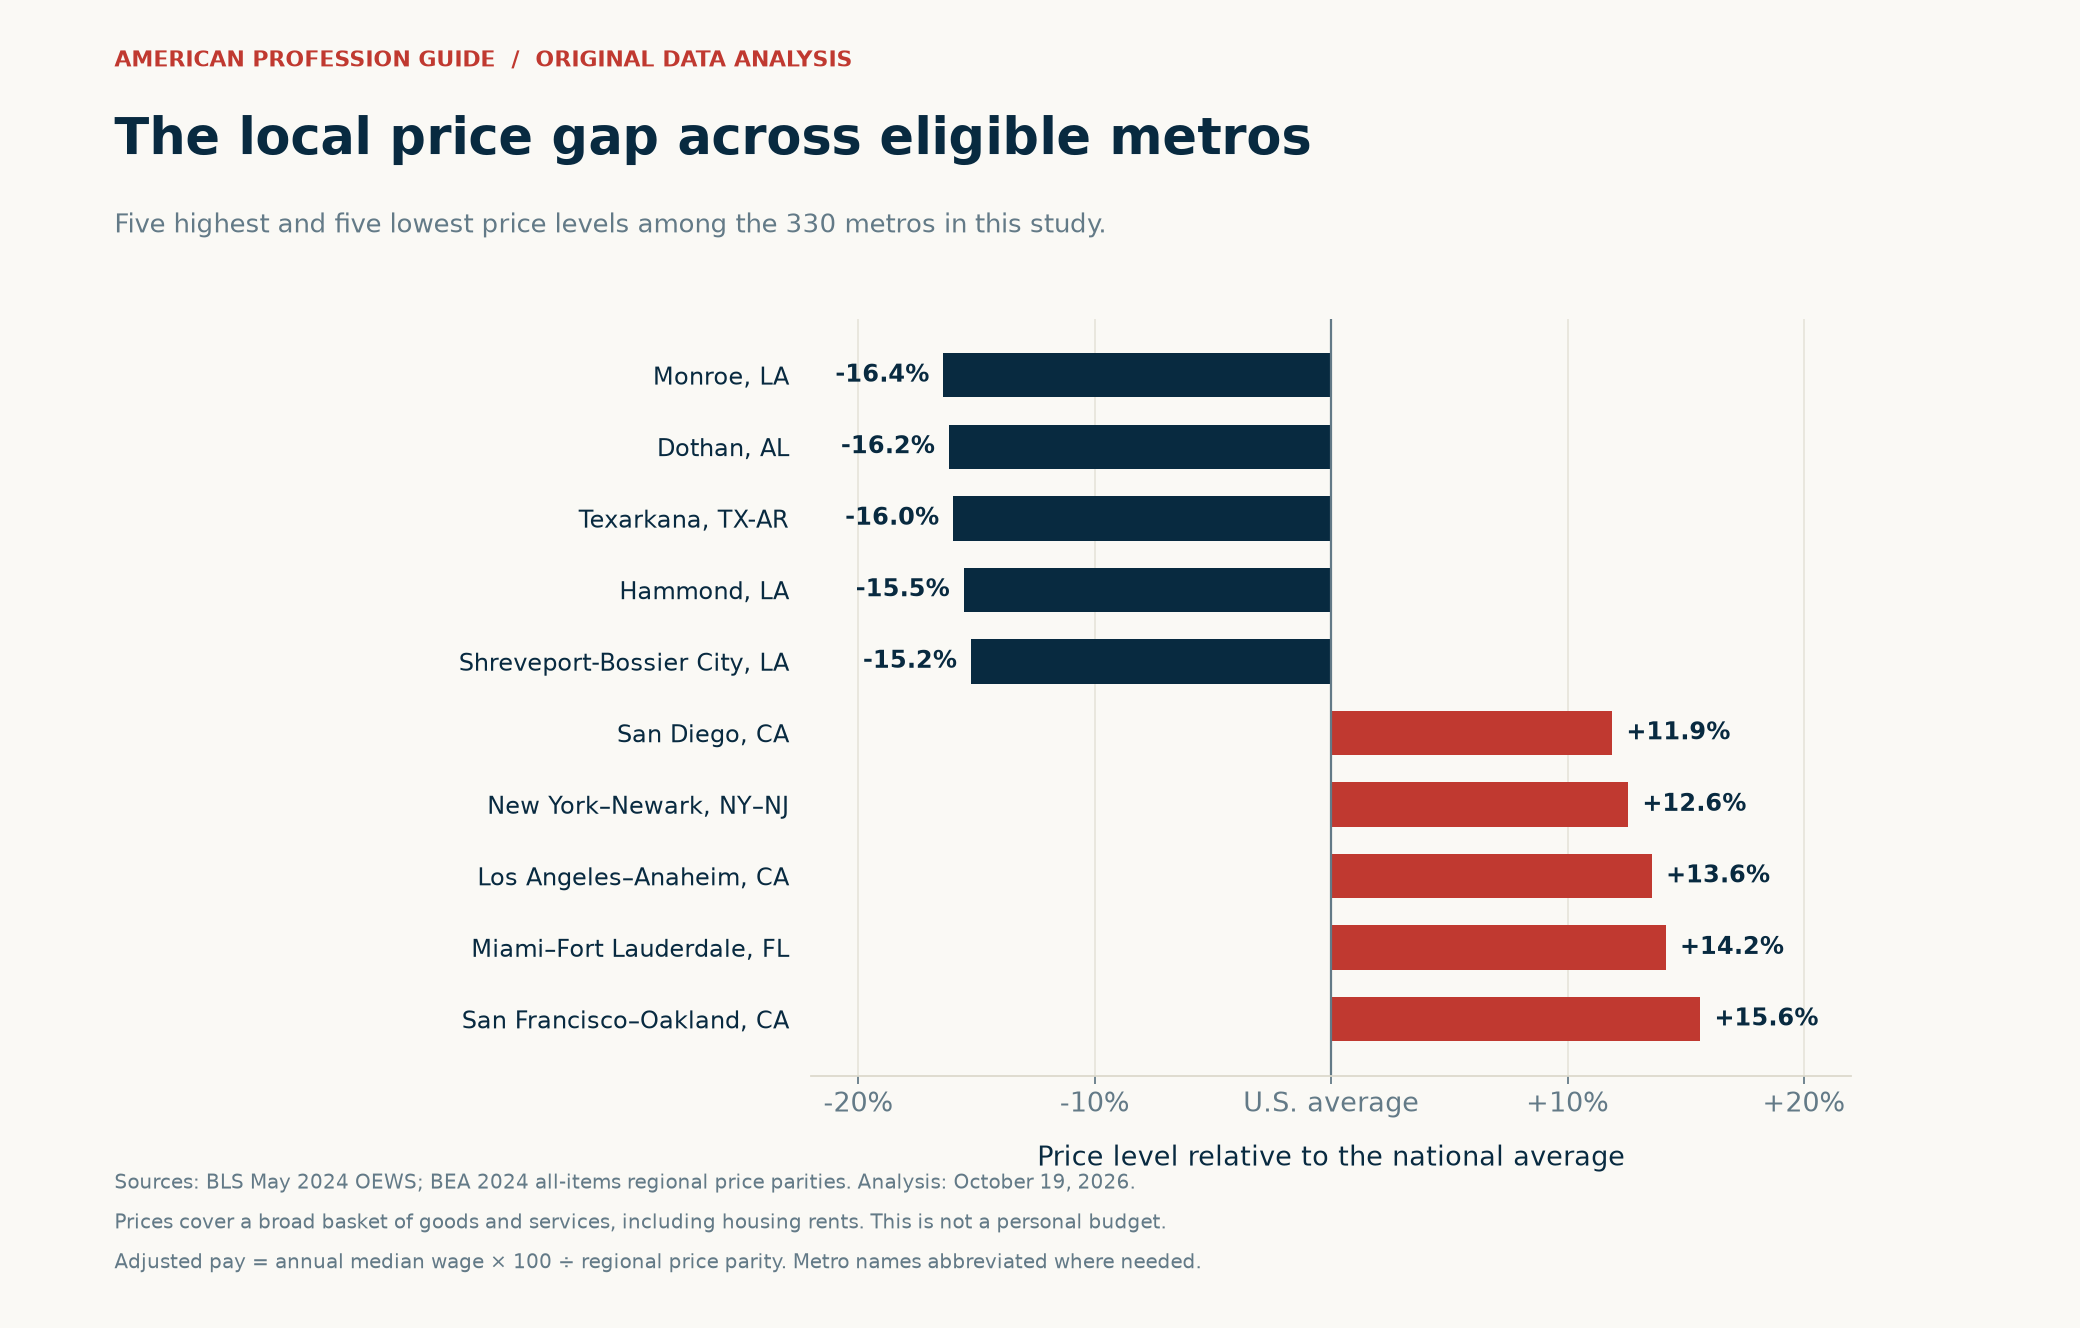
- Price levels vary widely. Among the study’s 330 metros, Monroe’s broad price index is 16.4% below the national average. San Francisco–Oakland’s is 15.6% above it.
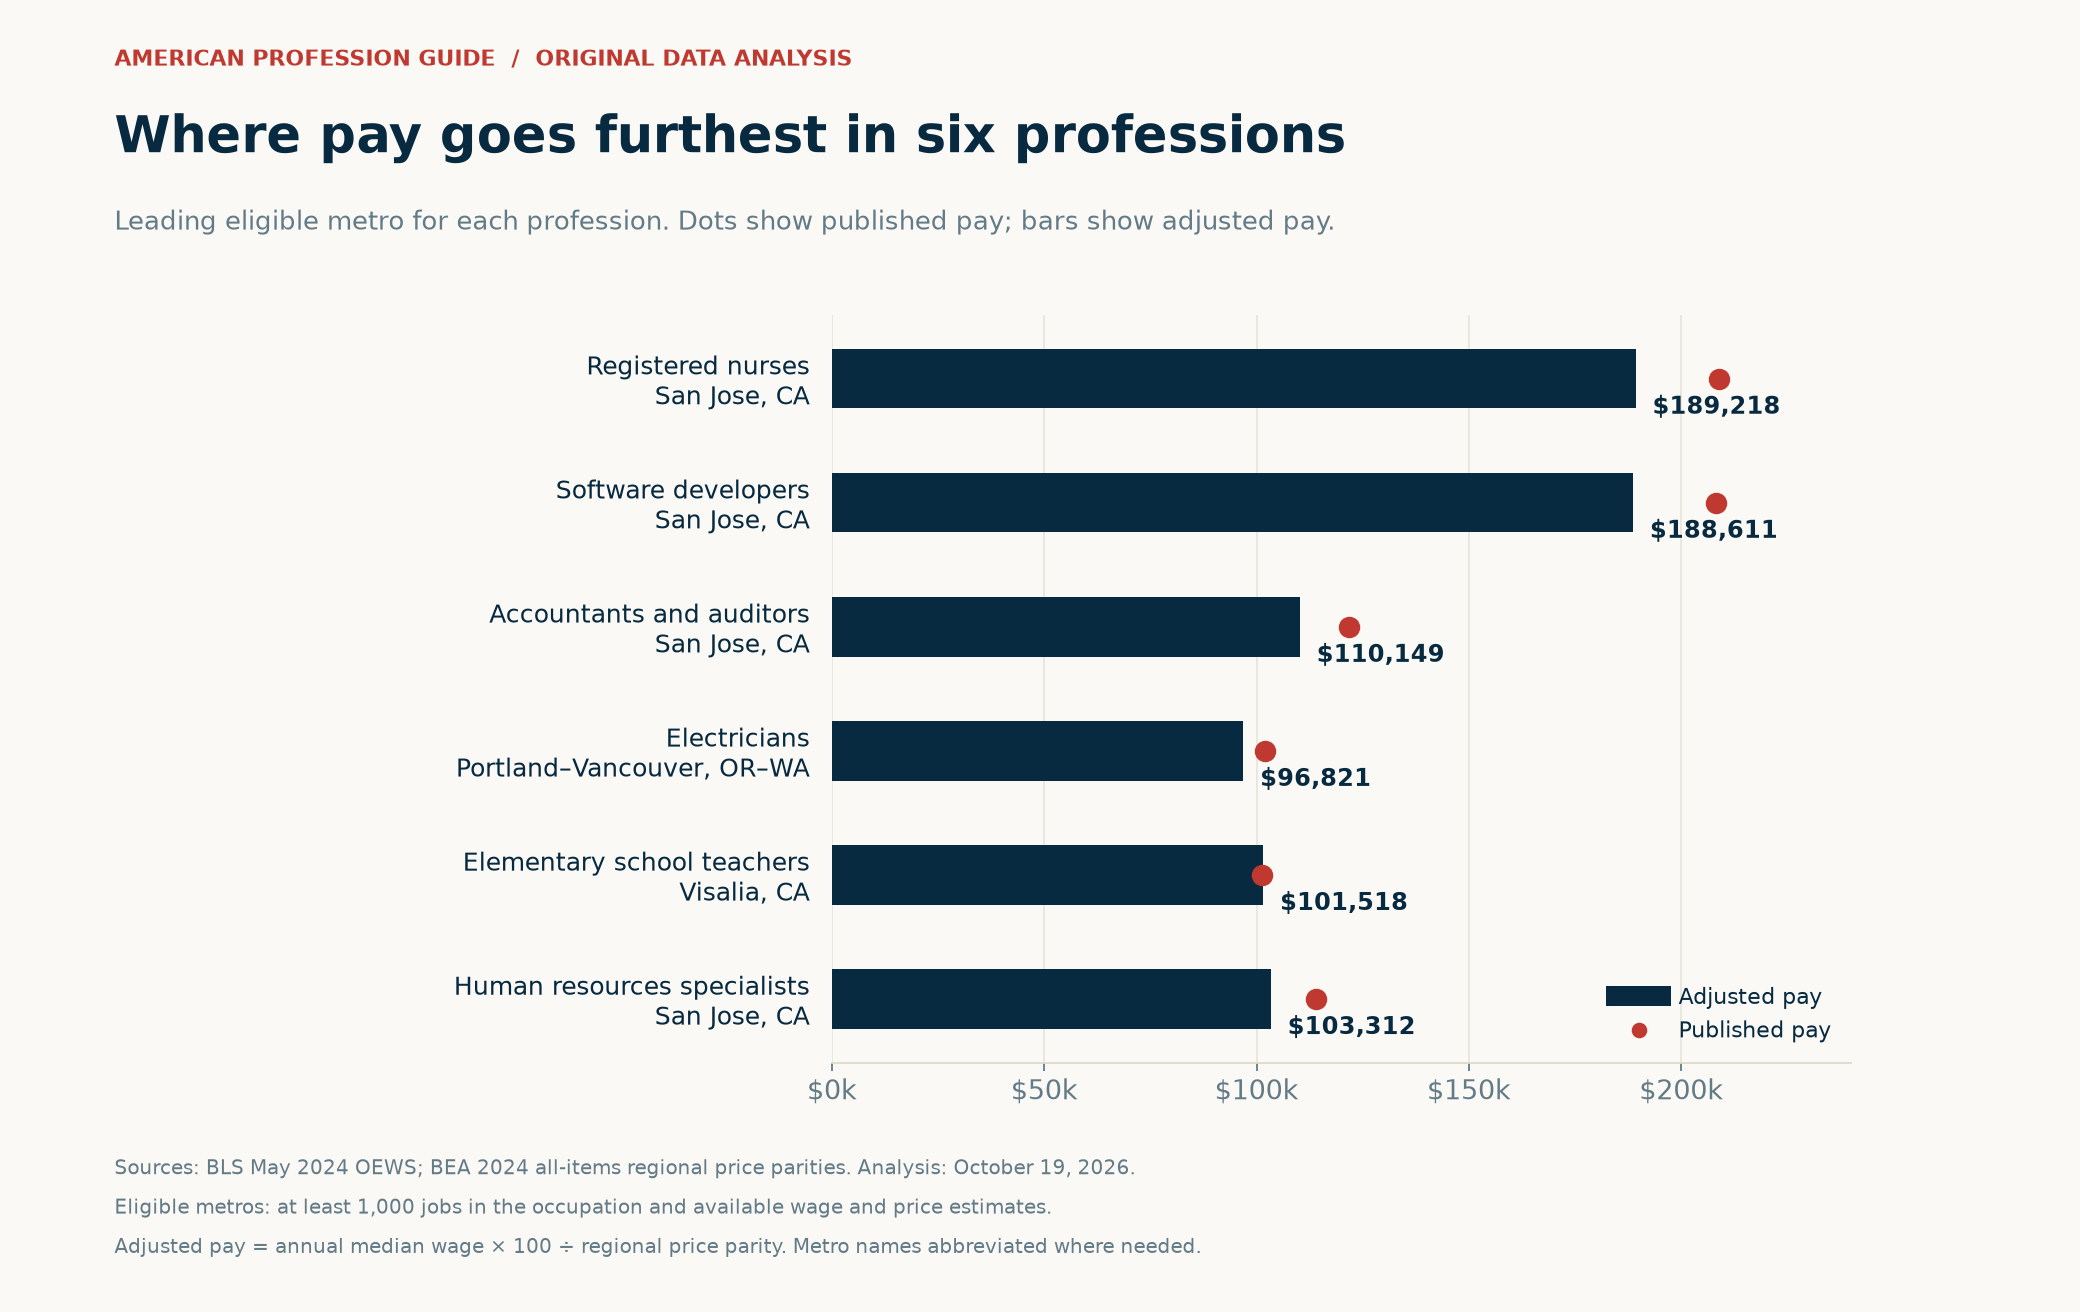
The central finding is specific: a low-cost location is not automatically the strongest pay market. Salary purchasing power depends on both the wage for your occupation and local prices. Therefore, compare metros within your profession before drawing conclusions about a move.
How we measure salary purchasing power
We start with the Bureau of Labor Statistics’ Occupational Employment and Wage Statistics, or OEWS. The annual median is the midpoint of an occupation’s wage distribution. We then use the Bureau of Economic Analysis’ regional price parities, or RPPs, to place metro wages on a common price basis.
Adjusted annual median wage = published annual median wage × 100 ÷ metro price index.
The national price index is 100. An index of 110 means the measured basket costs 10% more than the national average. An index of 90 means it costs 10% less. This adjustment covers broad consumer prices, including housing rents. It does not calculate an individual household’s living costs.
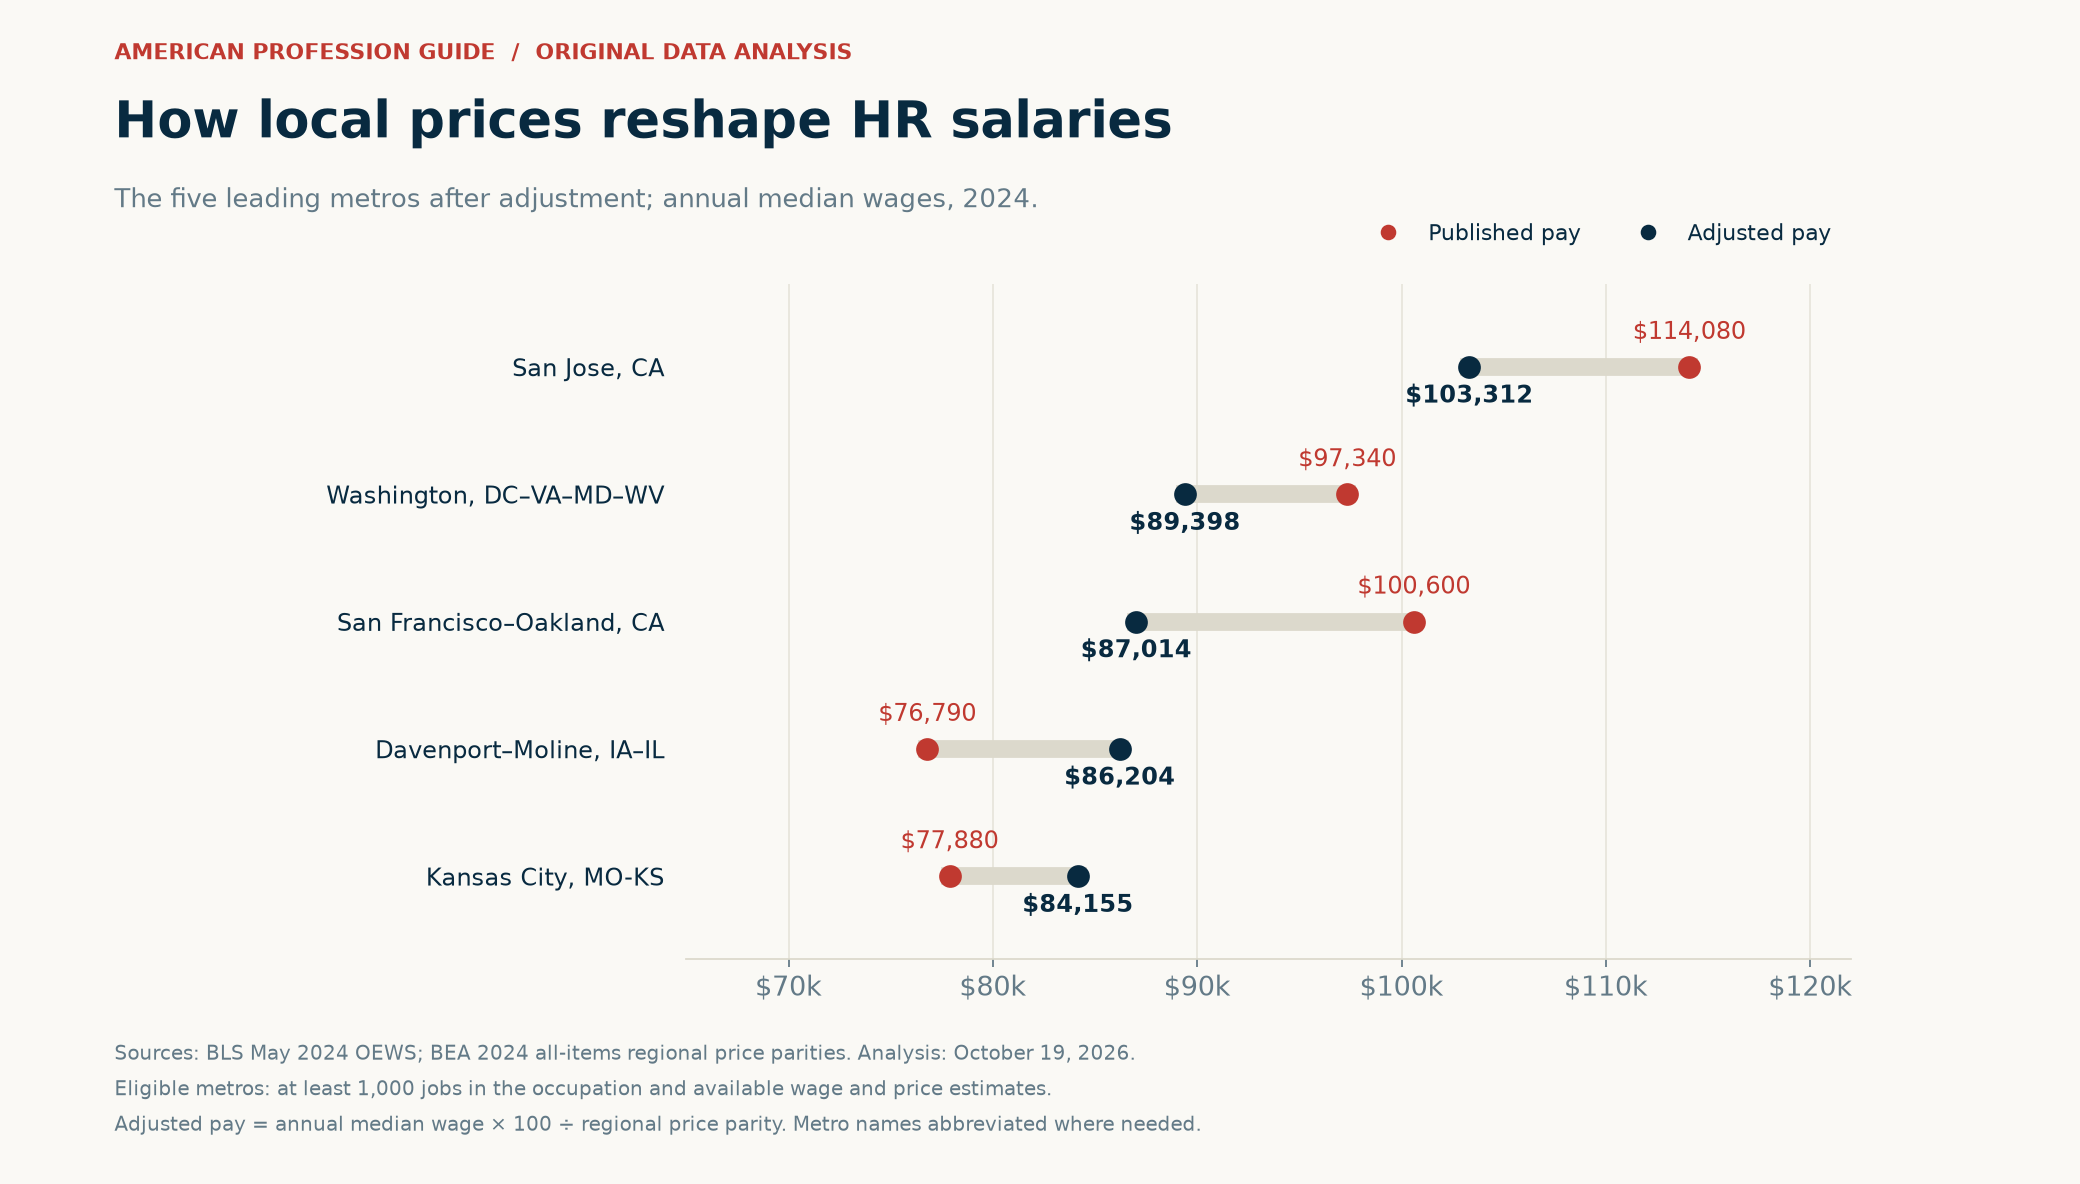
For example, HR specialists in Davenport–Moline–Rock Island have a published median wage of $76,790. The metro’s price index is 89.079. Thus, $76,790 × 100 ÷ 89.079 gives $86,204 in national-price purchasing power. The worker still earns $76,790. The larger adjusted figure expresses what that wage can buy at the benchmark price level.
In contrast, San Jose’s HR median of $114,080 becomes $103,312 after adjustment. San Jose still leads, even though its higher prices reduce the wage’s purchasing power. The calculation makes that trade-off visible without assuming every expensive metro performs poorly.
U.S. salary purchasing power rankings by profession
The six professions span healthcare, technology, accounting, skilled trades, elementary education, and human resources. We chose them as distinct career examples. They do not represent every occupation. Each ranking includes only metros with at least 1,000 estimated jobs in that profession and usable wage and price data.
| Profession | Eligible metros | Leading metro | Adjusted median pay |
|---|---|---|---|
| Registered nurses | 326 | San Jose-Sunnyvale-Santa Clara, CA | $189,218 |
| Software developers | 117 | San Jose-Sunnyvale-Santa Clara, CA | $188,611 |
| Accountants and auditors | 159 | San Jose-Sunnyvale-Santa Clara, CA | $110,149 |
| Electricians | 117 | Portland-Vancouver-Hillsboro, OR-WA | $96,821 |
| Elementary school teachers | 202 | Visalia, CA | $101,518 |
| HR specialists | 121 | San Jose-Sunnyvale-Santa Clara, CA | $103,312 |
Nurse salary purchasing power: California stays ahead
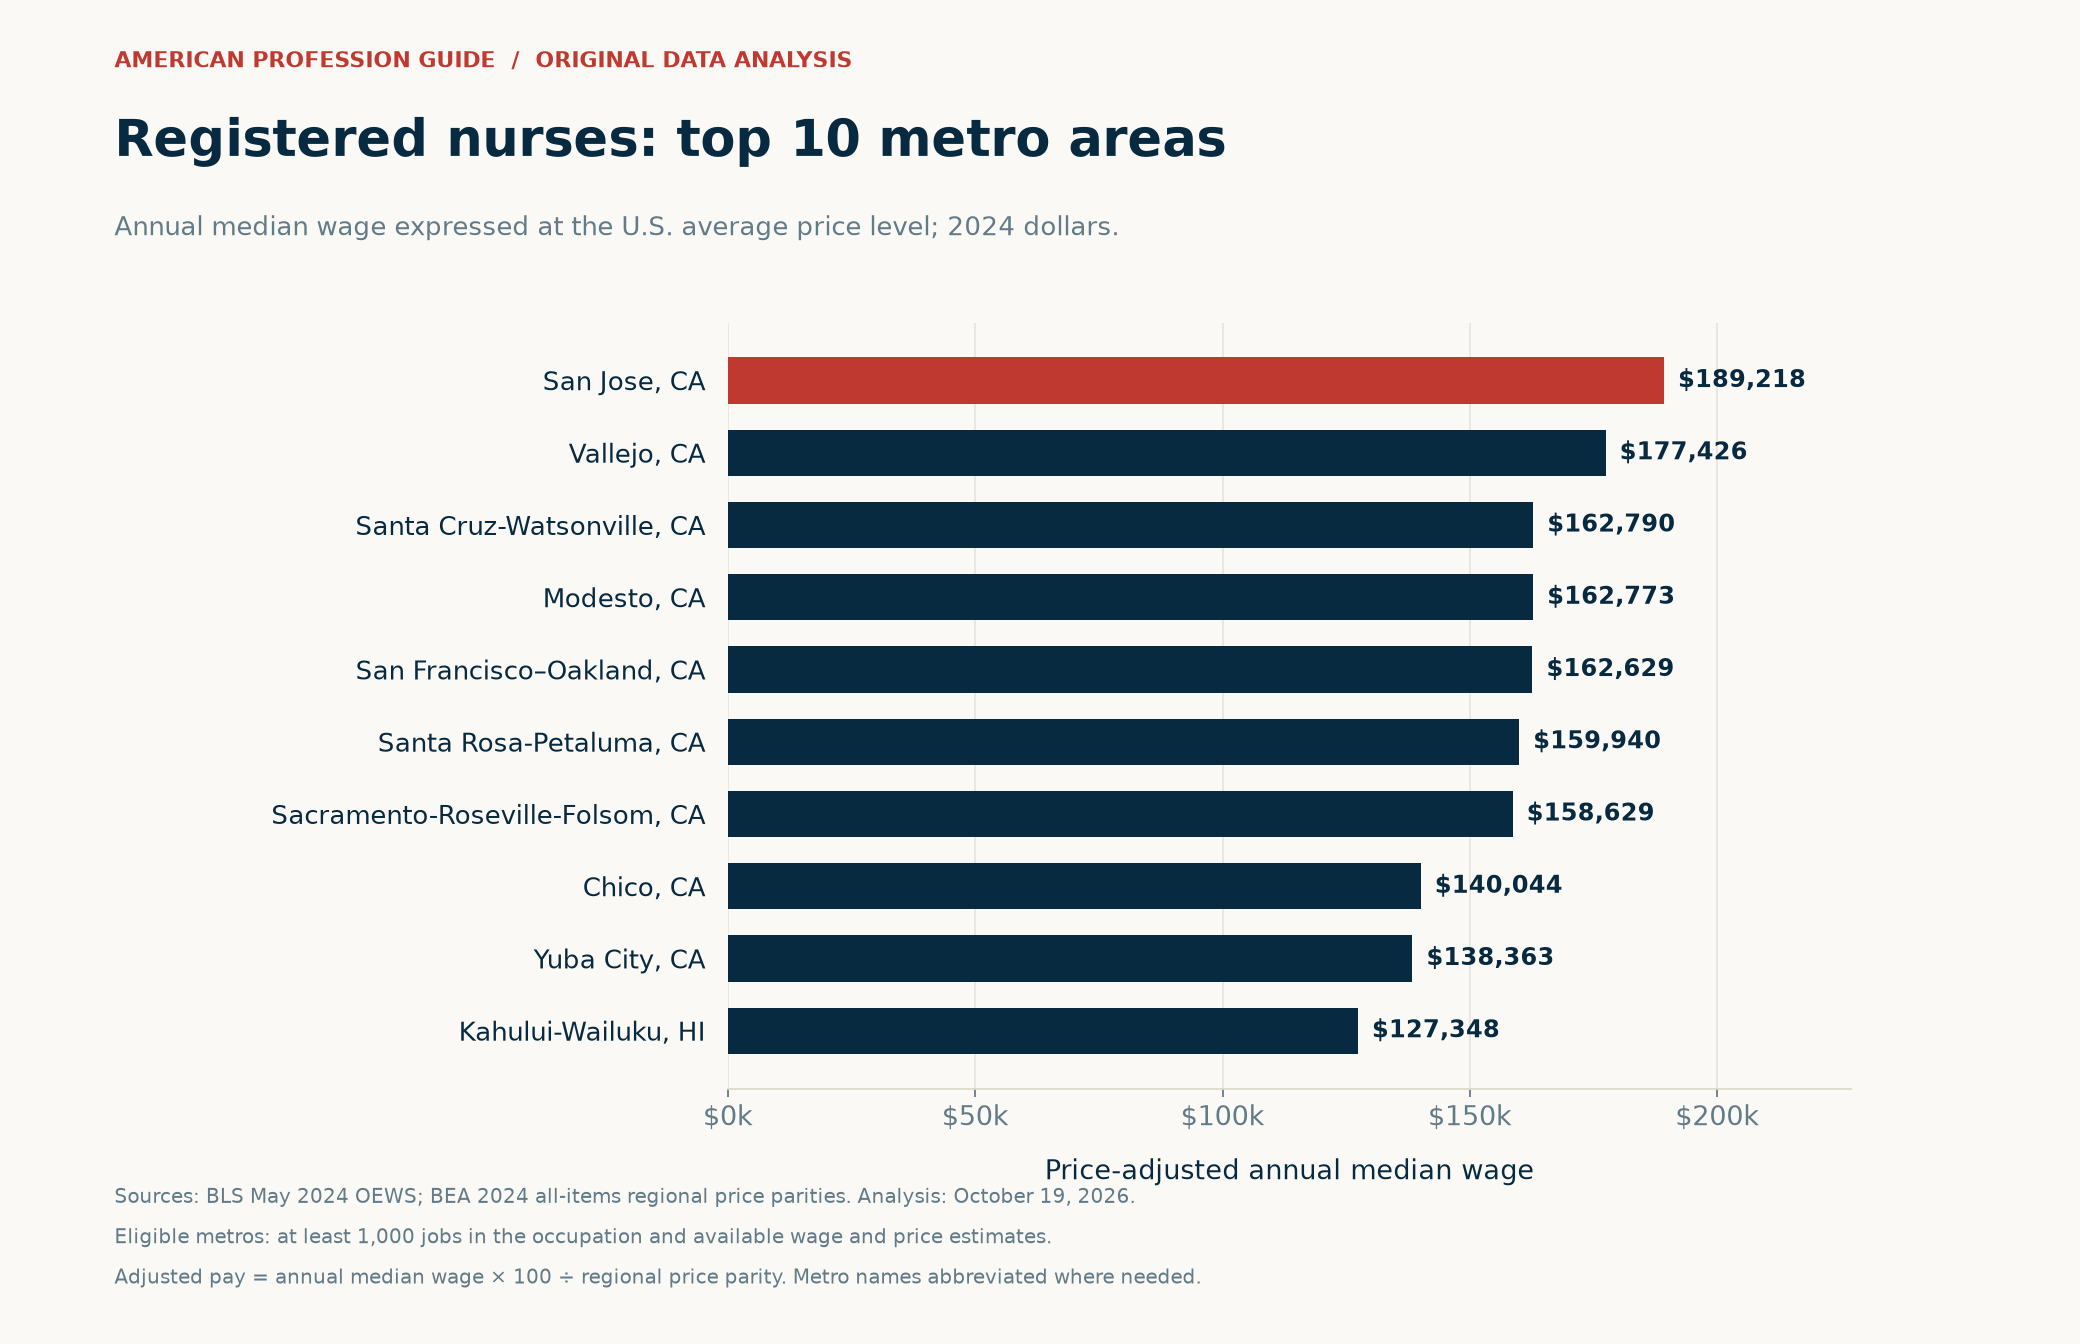
San Jose–Sunnyvale–Santa Clara ranks first among 326 eligible nursing metros. Its published annual median of $208,940 becomes $189,218 after adjustment. Vallejo follows at $177,426 in adjusted pay. Both remain well ahead of the next group in this dataset.
California metros occupy nine of the top ten places. However, the middle of that leading group is tightly clustered. Santa Cruz–Watsonville, Modesto, and San Francisco–Oakland have adjusted medians between roughly $162,600 and $162,800. Those small gaps should not drive a relocation decision.
| Rank | Metropolitan area | Published median pay | Price index | Adjusted median pay |
|---|---|---|---|---|
| 1 | San Jose-Sunnyvale-Santa Clara, CA | $208,940 | 110.423 | $189,218 |
| 2 | Vallejo, CA | $192,470 | 108.479 | $177,426 |
| 3 | Santa Cruz-Watsonville, CA | $178,900 | 109.896 | $162,790 |
| 4 | Modesto, CA | $169,460 | 104.108 | $162,773 |
| 5 | San Francisco-Oakland-Fremont, CA | $188,020 | 115.613 | $162,629 |
For nurses, the next step is to compare a real offer with local rent, hours, benefits, and commuting needs. A metro median describes a broad workforce. It does not promise the same pay to a new graduate, a particular specialty, or a specific employer’s applicant.
Software salary purchasing power: San Jose leads
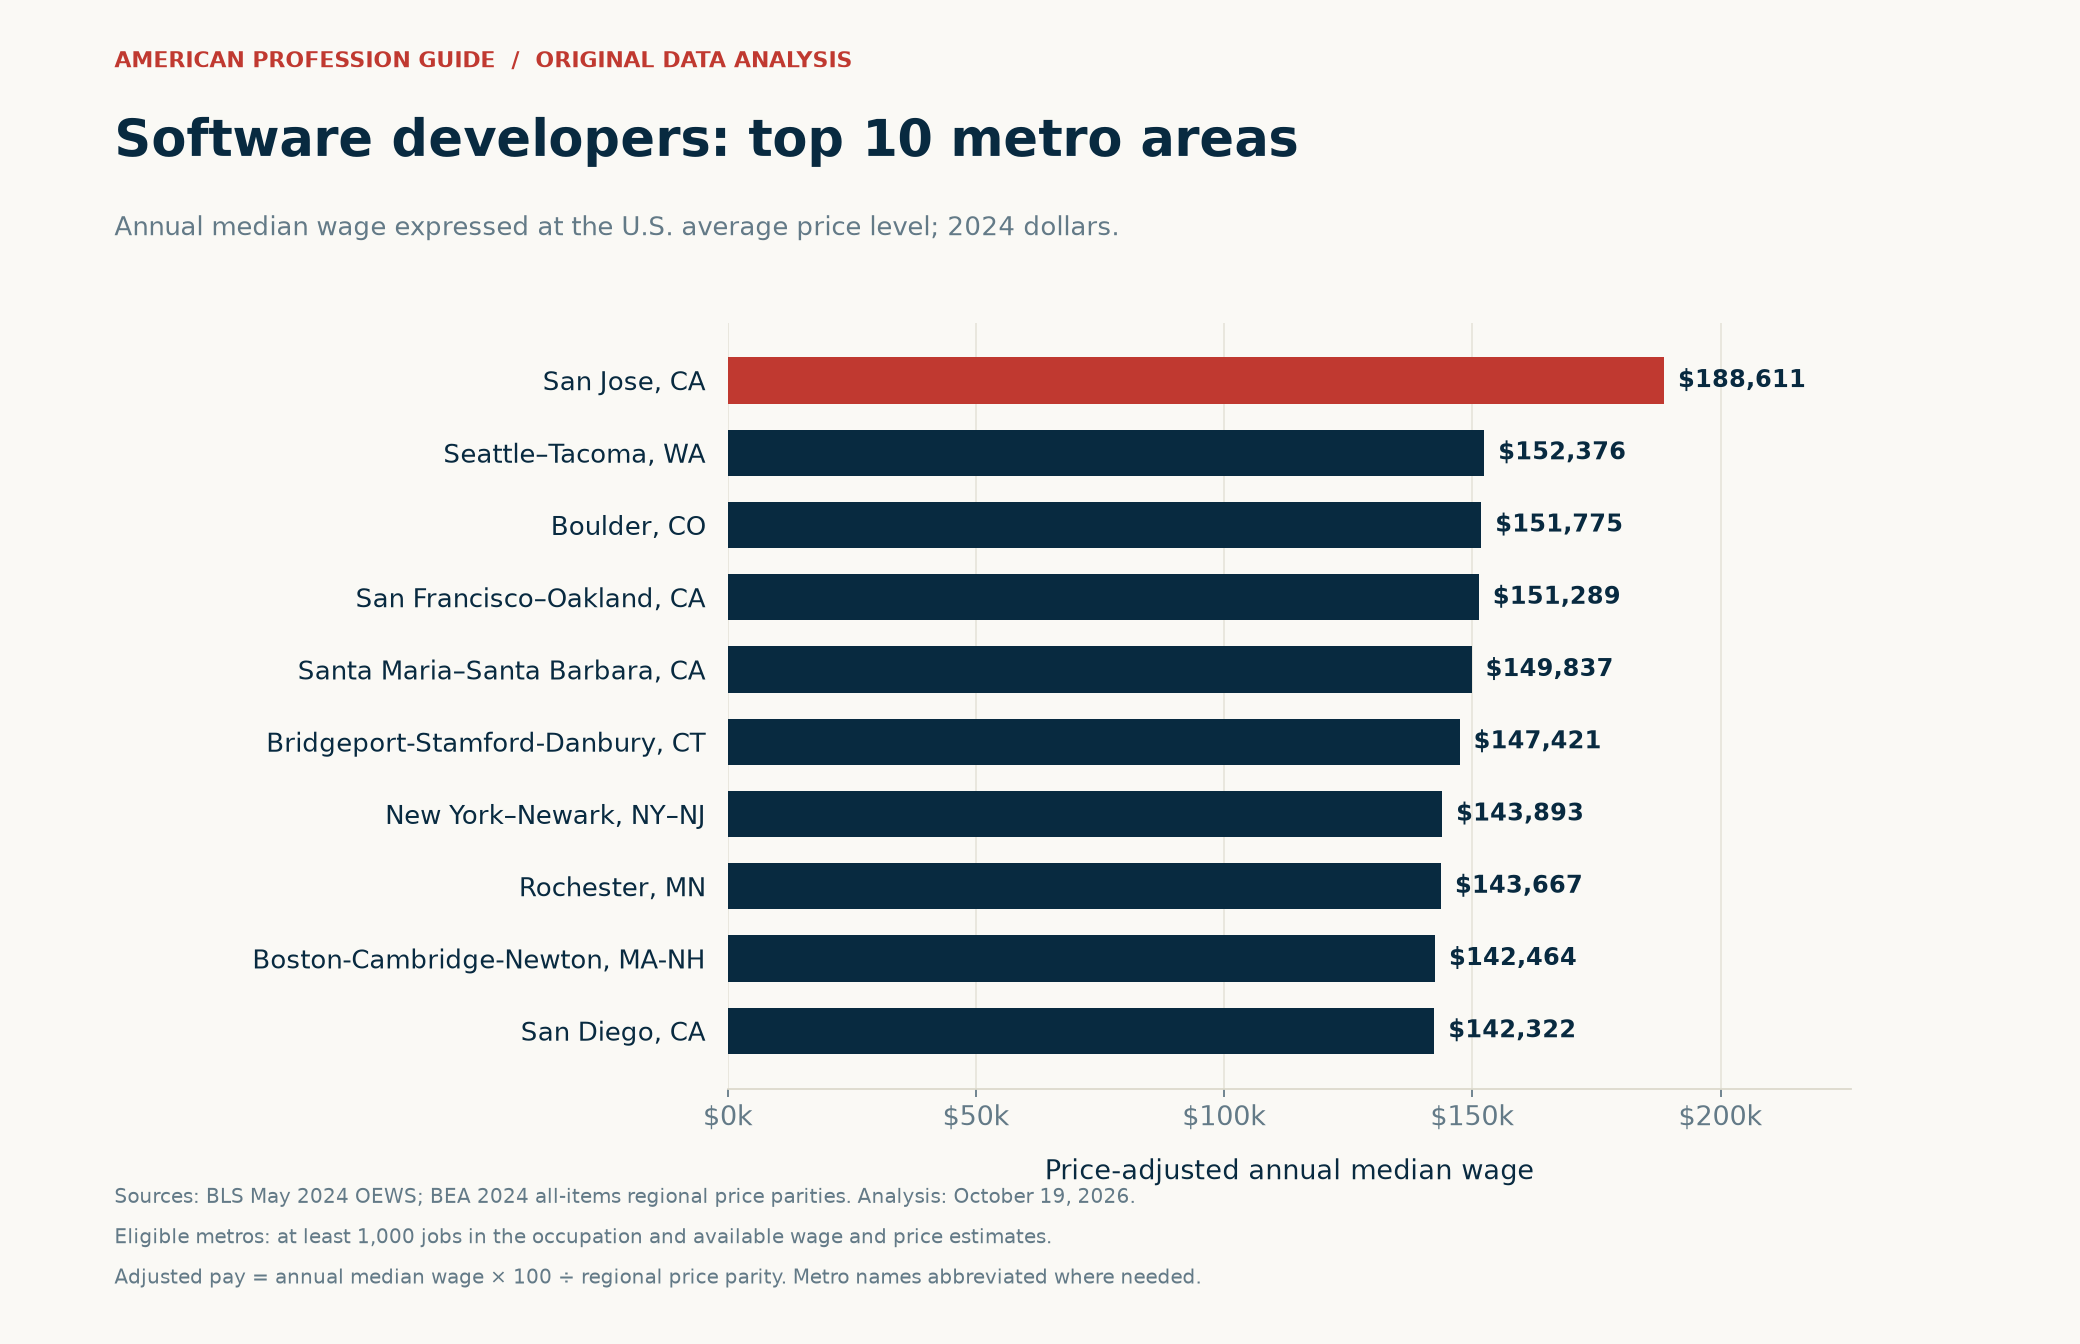
San Jose also leads the 117 eligible software markets. Its $208,270 published median becomes $188,611 after adjustment. Seattle follows at $152,376. Boulder ranks third at $151,775, narrowly ahead of San Francisco–Oakland at $151,289.
Rochester, Minnesota offers another useful example. It moves from 30th on published median pay to eighth after adjustment. Its published median is $130,480, compared with adjusted pay of $143,667. Meanwhile, San Diego moves from seventh to tenth, with adjusted pay of $142,322.
| Rank | Metropolitan area | Published median pay | Price index | Adjusted median pay |
|---|---|---|---|---|
| 1 | San Jose-Sunnyvale-Santa Clara, CA | $208,270 | 110.423 | $188,611 |
| 2 | Seattle-Tacoma-Bellevue, WA | $169,340 | 111.133 | $152,376 |
| 3 | Boulder, CO | $159,670 | 105.202 | $151,775 |
| 4 | San Francisco-Oakland-Fremont, CA | $174,910 | 115.613 | $151,289 |
| 5 | Santa Maria-Santa Barbara, CA | $163,020 | 108.798 | $149,837 |
These figures measure wages in the OEWS framework. They are not a comparison of complete technology compensation packages. Therefore, assess the actual offer’s benefits, bonus terms, and any equity separately. Remote work also requires care because a person’s home and employer location may differ.
Electricians: Portland and Chicago lead
Portland–Vancouver–Hillsboro ranks first for electricians, with a published median of $102,070 and adjusted pay of $96,821. Chicago ranks second at $96,086 after adjustment. Seattle, Canton–Massillon, and Minneapolis–St. Paul complete the top five.
Canton illustrates the value of looking beyond the headline salary. Its $81,120 median ranks ninth before adjustment. With local prices about 10.6% below the national average, its adjusted pay rises to $90,732 and its rank improves to fourth.
| Rank | Metropolitan area | Published median pay | Price index | Adjusted median pay |
|---|---|---|---|---|
| 1 | Portland-Vancouver-Hillsboro, OR-WA | $102,070 | 105.421 | $96,821 |
| 2 | Chicago-Naperville-Elgin, IL-IN | $99,540 | 103.595 | $96,086 |
| 3 | Seattle-Tacoma-Bellevue, WA | $101,600 | 111.133 | $91,422 |
| 4 | Canton-Massillon, OH | $81,120 | 89.406 | $90,732 |
| 5 | Minneapolis-St. Paul-Bloomington, MN-WI | $95,090 | 104.822 | $90,716 |
Canton and Minneapolis differ by only about $16 in their calculated adjusted annual medians. Treat them as essentially level for practical planning. Moreover, employment counts describe existing jobs rather than vacancies. The study does not measure how easily a worker can find a job in either market.
Accountants and auditors: Trenton moves into second place
Among 159 eligible markets, San Jose leads accountants and auditors at $110,149 in adjusted median pay. Trenton–Princeton follows at $94,660. New York–Newark ranks third at $93,370, ahead of Bridgeport–Stamford–Danbury and San Francisco–Oakland.
Trenton ranks seventh using published pay alone. Its relatively modest price premium helps it rise to second after adjustment. San Francisco–Oakland moves from second to fifth. As a result, a salary-only comparison would give a different picture of these accounting markets.
| Rank | Metropolitan area | Published median pay | Price index | Adjusted median pay |
|---|---|---|---|---|
| 1 | San Jose-Sunnyvale-Santa Clara, CA | $121,630 | 110.423 | $110,149 |
| 2 | Trenton-Princeton, NJ | $97,670 | 103.180 | $94,660 |
| 3 | New York-Newark-Jersey City, NY-NJ | $105,100 | 112.563 | $93,370 |
| 4 | Bridgeport-Stamford-Danbury, CT | $98,080 | 106.864 | $91,780 |
| 5 | San Francisco-Oakland-Fremont, CA | $105,750 | 115.613 | $91,469 |
The ranking combines accountants and auditors under one federal occupation code. It does not isolate licensed CPAs, tax specialists, entry-level staff, or finance managers. Use the results to identify markets for further research, then compare roles with similar responsibilities and experience requirements.
Elementary teachers: Merced makes a large move
Visalia leads the 202 eligible elementary-teacher markets. Its adjusted annual median is $101,518. Merced ranks second at $99,110, followed by Olympia–Lacey–Tumwater, Modesto, and Bremerton–Silverdale–Port Orchard.
Merced’s published median of $97,400 ranks 15th. Its price index of 98.275 brings it to second after adjustment. This is a clear example of why salary purchasing power can produce a different shortlist from gross salary alone.
| Rank | Metropolitan area | Published median pay | Price index | Adjusted median pay |
|---|---|---|---|---|
| 1 | Visalia, CA | $101,340 | 99.825 | $101,518 |
| 2 | Merced, CA | $97,400 | 98.275 | $99,110 |
| 3 | Olympia-Lacey-Tumwater, WA | $101,170 | 103.670 | $97,589 |
| 4 | Modesto, CA | $100,430 | 104.108 | $96,467 |
| 5 | Bremerton-Silverdale-Port Orchard, WA | $100,620 | 105.607 | $95,278 |
This occupation excludes special education teachers. BLS reports annual wages for teachers without assuming that they work 2,080 hours each year. Consequently, these results should not be interpreted as hourly compensation or as a comparison of contract length, workload, pensions, or district salary schedules.
Human resources: Davenport and Kansas City enter the top five
San Jose leads HR specialists at $103,312 in adjusted pay. Washington–Arlington–Alexandria ranks second at $89,398, followed by San Francisco–Oakland at $87,014. Davenport–Moline–Rock Island and Kansas City complete the top five.
Davenport rises from 22nd on published pay to fourth after adjustment. Kansas City moves from 19th to fifth. In both cases, below-average regional prices strengthen the buying power of wages that appear less competitive before adjustment.
| Rank | Metropolitan area | Published median pay | Price index | Adjusted median pay |
|---|---|---|---|---|
| 1 | San Jose-Sunnyvale-Santa Clara, CA | $114,080 | 110.423 | $103,312 |
| 2 | Washington-Arlington-Alexandria, DC-VA-MD-WV | $97,340 | 108.884 | $89,398 |
| 3 | San Francisco-Oakland-Fremont, CA | $100,600 | 115.613 | $87,014 |
| 4 | Davenport-Moline-Rock Island, IA-IL | $76,790 | 89.079 | $86,204 |
| 5 | Kansas City, MO-KS | $77,880 | 92.543 | $84,155 |
The gap between Davenport and San Francisco–Oakland shrinks substantially after adjustment. Their published medians differ by $23,810. Their adjusted medians differ by about $810. Even so, a household’s housing needs, taxes, and employer benefits could change which offer works better.
How to use salary purchasing power when comparing offers
Start with your occupation’s ranking, then build a shortlist that fits your career goals. Next, check current vacancies and salary ranges for your experience level. The study’s 2024 benchmark provides context, while current offers show what employers will actually pay you.

- Compare the full offer. Include working hours, paid leave, health coverage, retirement contributions, and predictable bonuses.
- Price your own housing. Check homes that meet your space and commute needs. A regional average cannot describe every neighborhood.
- Build an after-tax budget. Use the relevant tax rules and your household situation. Our adjustment does not calculate take-home pay.
- Check access to work. Review licensing, job openings, commute time, and the cost of moving. A high ranking does not remove those constraints.
- Test the result. Recalculate your budget with a higher rent or a lower offer. This shows how much room you have if conditions change.
For help with the next stage of a job search, see our U.S. career planning and job-search roadmap. You can also explore our business and financial career guides or engineering and technical career guides.
Methodology, coverage, and limits
Data sources and shared reference year
We downloaded the BLS May 2024 metropolitan wage workbook and the BEA metropolitan regional price parity files on October 19, 2026. Wage calculations use the annual median field, A_MEDIAN. Prices use MARPP line 1, “RPPs: All items,” for 2024. The BEA file was updated on February 19, 2026.
Both sources use metro definitions from OMB Bulletin 23-01. We joined them using five-digit metro codes. This aligns the statistical areas instead of relying on city names that may be abbreviated differently. A metro includes its surrounding communities and may cross state boundaries.
The downloaded wage workbook includes Colorado estimates. BLS released those estimates on July 23, 2025, after the original release excluded them. Thus, Boulder is part of this analysis.
Selection and ranking rules
The occupation codes are 29-1141 for registered nurses, 15-1252 for software developers, 13-2011 for accountants and auditors, 47-2111 for electricians, 25-2021 for elementary teachers except special education, and 13-1071 for HR specialists.
We retained metropolitan areas with a numeric annual median wage, a numeric all-items price index, and at least 1,000 estimated jobs in the occupation. The employment threshold focuses the comparison on established local workforces. It is our editorial inclusion rule, not a guarantee of statistical precision. Missing or suppressed figures remain excluded; they are never treated as zero.
We ranked adjusted wages from highest to lowest within each profession. Published-pay ranks use exactly the same eligible metros. Equal input values share the lowest applicable rank, and calculations use unrounded values. The article rounds adjusted dollars for readability. The downloadable file retains additional decimal places for reproducibility.
Limits of these salary purchasing power rankings
- Wages are estimates. Small differences may reflect sampling or modeling uncertainty. We have not tested whether pairs of adjusted wages differ statistically.
- These are gross wage comparisons. The adjustment does not deduct income taxes or calculate disposable income. It also does not price an individual household’s spending pattern.
- OEWS has a defined scope. It covers wage and salary employment and excludes self-employed workers. Its pay measure also excludes overtime premiums and employer benefit costs.
- Prices are regional averages. Housing rents are part of the broad basket. A household seeking a particular home, school district, or commute may face very different costs.
- Ranks depend on coverage. Smaller job markets and rows with missing data do not qualify. Puerto Rico metros do not have matching price values in this BEA file. Nonmetropolitan areas are outside this study.
- This is a geographic comparison. Adjusted dollars express 2024 wages at the national 2024 price level. They are not inflation-adjusted 2026 dollars or a measure of wage growth.
For further detail, consult the BLS May 2024 technical notes and BEA’s regional price methodology. American Profession Guide calculated the adjusted wages and rankings. Neither agency produced or endorsed these rankings.
Frequently asked questions
Does a higher adjusted salary mean I will save more?
Not necessarily. It indicates stronger gross-wage purchasing power under a broad regional price index. Your savings also depend on taxes, housing, debt payments, benefits, family needs, and spending choices.
Why use 2024 data in a 2026 article?
The edition date identifies when we prepared the study. The data year identifies what we measured. As of the research date, 2024 is the latest shared year for these wage and regional-price sources. We state both dates so readers can assess the benchmark correctly.
Transform Your Career Today
Unlock a personalized career strategy that drives real results. Get tailored advice and a roadmap designed just for you.
Start NowCan I use these rankings for a remote job?
Use caution. The wage estimate reflects the employer reporting location, while the price adjustment uses that metro’s prices. If you live elsewhere, compare your actual offer with the prices where you will spend it.
Download the data and cite the study
Download all 1,042 eligible occupation–metro comparisons (CSV). The file includes metro and occupation codes, employment, published median wages, price indexes, adjusted wages, both rankings, data years, and source URLs. Open it in Excel, Google Sheets, or another data tool.
To reproduce a result, multiply its published annual median wage by 100 and divide by its 2024 price index. Then sort the results within the same occupation. Keep the employment filter and missing-data rules unchanged when checking the published ranks.
Suggested citation: American Profession Guide. “Where Your Salary Goes Furthest: U.S. Metro Rankings by Profession (2026).” Analysis of BLS May 2024 OEWS and BEA 2024 regional price parities. Research date: October 19, 2026. When referencing the findings or charts, link to this article and retain the source and data-year notes.
The featured and household illustrations are AI-generated editorial artwork. All statistical charts come from the source data and calculations described above.